Reading the Clocks
In 60 seconds
Five composite indicators operationalise the regime claim across the prior essays. As of May 2026, three sit at or above their thresholds (Howell liquidity, AI capex/sales ratio, credit-fragility composite); two sit below (Mag 7 EPS revisions, OASI legislation). The dashboard is the manuscript's commitment to falsifiability: when the indicators move, the bear case updates.
In the autumn of 2007, the clocks were ticking. Not one clock — the yield curve, or the TED spread, or the co-movement signal Bar-Yam's group at the New England Complex Systems Institute had been tracking for four years.1 All of them, simultaneously, pointed in the same direction. The US Treasury yield curve had inverted in mid-2006 and stayed inverted. The TED spread had begun to widen in August 2007 to levels not seen since the 1987 crash. The cross-equity correlation Bar-Yam's group was measuring had been rising continuously since 2004 — a structural signal that the equity market was becoming progressively more internally correlated, less genuinely diversified, more dependent on a single shared factor underneath the surface. Nobody needed a crystal ball. They needed a dashboard.
The lesson from 2007 is not that multi-signal convergence predicts crisis dates. The lesson is that when previously independent signals start reading together, the independence was always cosmetic — the shared structural condition is revealing itself through multiple diagnostic channels. The yield curve was reading the credit market. The TED spread was reading the interbank market. The NECSI co-movement signal was reading the equity market. Three independent diagnostics, three different data sets, three different methodologies, one composite reading of the same configuration through different lenses.
The 2026 configuration shows the same composite pattern. The diagnostic block of this manuscript identified the structural conditions across the preceding essays. The prior essay named the meta-clock and its four sub-readings; this essay does not revisit that diagnosis. It constructs the operational apparatus for reading those clocks in real time: five indicators, drawn from primary institutional sources, each paired with an explicit threshold condition and a falsification condition. The clocks are running. The question is how to read them honestly.
I. Why a Dashboard, Not a Forecast
The distinction between a dashboard and a forecast is not aesthetic. It is the difference between epistemically honest and epistemically dishonest engagement with an uncertain future. A forecast names a date and an outcome. A dashboard names the conditions that would confirm or disconfirm a regime claim, and it names them in advance.
The distinction matters because it sits inside a methodological category that has been empirically tested. Philip Tetlock's Good Judgment Project — the multi-year research programme that began in the late 2000s and produced its operating treatment in Superforecasting (Crown Publishers, 2015) — established that calibrated probability is a learnable skill with measurable accuracy.2 The accuracy is not universal. It is conditional. Calibrated reading works when the reference class is well-populated, the components are arithmetically constrained, and the forecaster updates on falsification rather than on reinterpretation. Where those conditions hold, the calibration discipline produces measurable improvement over baseline expert judgment. Where they do not — where the underlying distribution is fat-tailed and historically sparse, where the components are themselves the products of regime change rather than constraints within a stable regime — the calibration apparatus systematically misreads its own confidence intervals.
This essay is in the conditional domain Tetlock's research validates. Sovereign debt maturity calendars are fixed at the date of issuance. Demographic projections are actuarial across a multi-decade horizon. Liquidity cycle durations are structurally tied to debt-maturity profiles. Every threshold in the dashboard below is derivable from primary arithmetic against a published institutional series. The reference class for each indicator is well-populated; the components are arithmetically constrained; the falsification conditions are stated before the signals arrive.
Severity is a different question entirely. Taleb's framework establishes that fat-tailed distributions cannot be calibrated from sparse historical samples; the how bad question about a major sovereign-financial stress episode sits in that domain, not the when are the conditions present question.3 This essay reads the timing of convergence; it does not read the severity of what crystallises when the clocks tick together — that remains, as Taleb's framework establishes, genuinely unknowable in advance. The Tetlock domain and the Taleb domain are not in tension. They operate at different levels. The manuscript carries both because the claims are layered: the fragility apparatus explains what is at stake; the convergence apparatus explains when the at-stake is likely to manifest.
Falsification discipline is named upfront, not saved for the end. A dashboard without falsification conditions is a confirmation-bias machine wearing analytical clothing. Every indicator in the dashboard below carries an explicit falsification condition — the reading that would falsify that specific indicator's analytical claim, not merely defer it. The method is Bayesian in structure rather than in surface vocabulary. Prior beliefs — the regime claim from the diagnostic block — update on new signal; the update rules are stated here, not invented at the point of signal arrival.
The discipline that holds the whole apparatus together is simple: the analyst who moves the goalposts when a falsification condition approaches has exited the calibrated-probability domain and entered something else. State the conditions in advance. Watch the indicators against them. Update when the conditions are genuinely met — not when the signal is convenient.
The dragonfly-eye aggregation method — independent frameworks arriving at convergent conclusions through different analytical starting points — governs the dashboard that follows. The apparent independence of the five indicators is partial: the meta-clock (Howell) is the master variable; the other four indicators are coupled to it through the dollar-liquidity vector. The convergence reading is what emerges when the master clock's transition is confirmed by the sub-readings on their own data.
II. The Indicator Dashboard
The dashboard is the chapter's central artefact. The five indicators, paired one-to-one with threshold and falsification conditions, are first set out as a single table; the prose that follows is commentary on the rows.
| # | Indicator | Position (May 2026) | Threshold for "at-or-above" | Falsification condition | Source-essay |
|---|---|---|---|---|---|
| 1 | Howell Global Liquidity Index | Cycle position: peak → rolling over | Above prior cycle peak | Index stays elevated through 2027 with no rollover | Essay 12 |
| 2 | Hyperscaler AI capex / sales ratio | ~50% (utility-like) | Above 30% sustained | Drops below 25% with sales growth >35%/yr | Essay 4 |
| 3 | Mag 7 forward EPS revisions × multiple behaviour (conjunction) | EPS strong; multiple at extension | Conjunction (BOTH legs adverse): EPS revisions -10% YoY AND multiple compression >25% | Conjunction (BOTH legs benign): EPS revisions hold/accelerate AND multiple expands, for two consecutive quarters | Essay 2 |
| 4 | OASI / HI legislative action | Zero legislative movement in 18 months | Trustees Report adoption of 2032 OASI date | Pre-emptive bipartisan legislation moves the depletion date | Essay 1 |
| 5 | Credit-fragility composite | Three sub-readings adverse: shadow default 6%, CMBS office 12.3%, Q1 redemption squeeze cleared with gates | Two of three sub-readings adverse | All three normalise; no second redemption squeeze in 2026 | Essay 12 |
Current reading: 3 of 5 at or above threshold; 2 of 5 below. Three (Howell, hyperscaler capex/sales, credit-fragility composite) are sitting in stressed configurations. Two (Mag 7 EPS × multiple conjunction, OASI legislation) are not currently triggering — strong earnings at extended multiples have neither confirmed the bear conjunction nor closed the falsification conjunction, and the political-economy machinery has not produced legislation in either direction.
Reading discipline: this is not a vote-count. The composite breaks if the two unmet conjunction conditions both flip benign — Mag 7 EPS holding/accelerating with multiple expansion across two quarters, and pre-emptive OASI/HI legislation moving the depletion date. The bear case strengthens if any one of the two below-threshold indicators crosses up to the adverse conjunction.
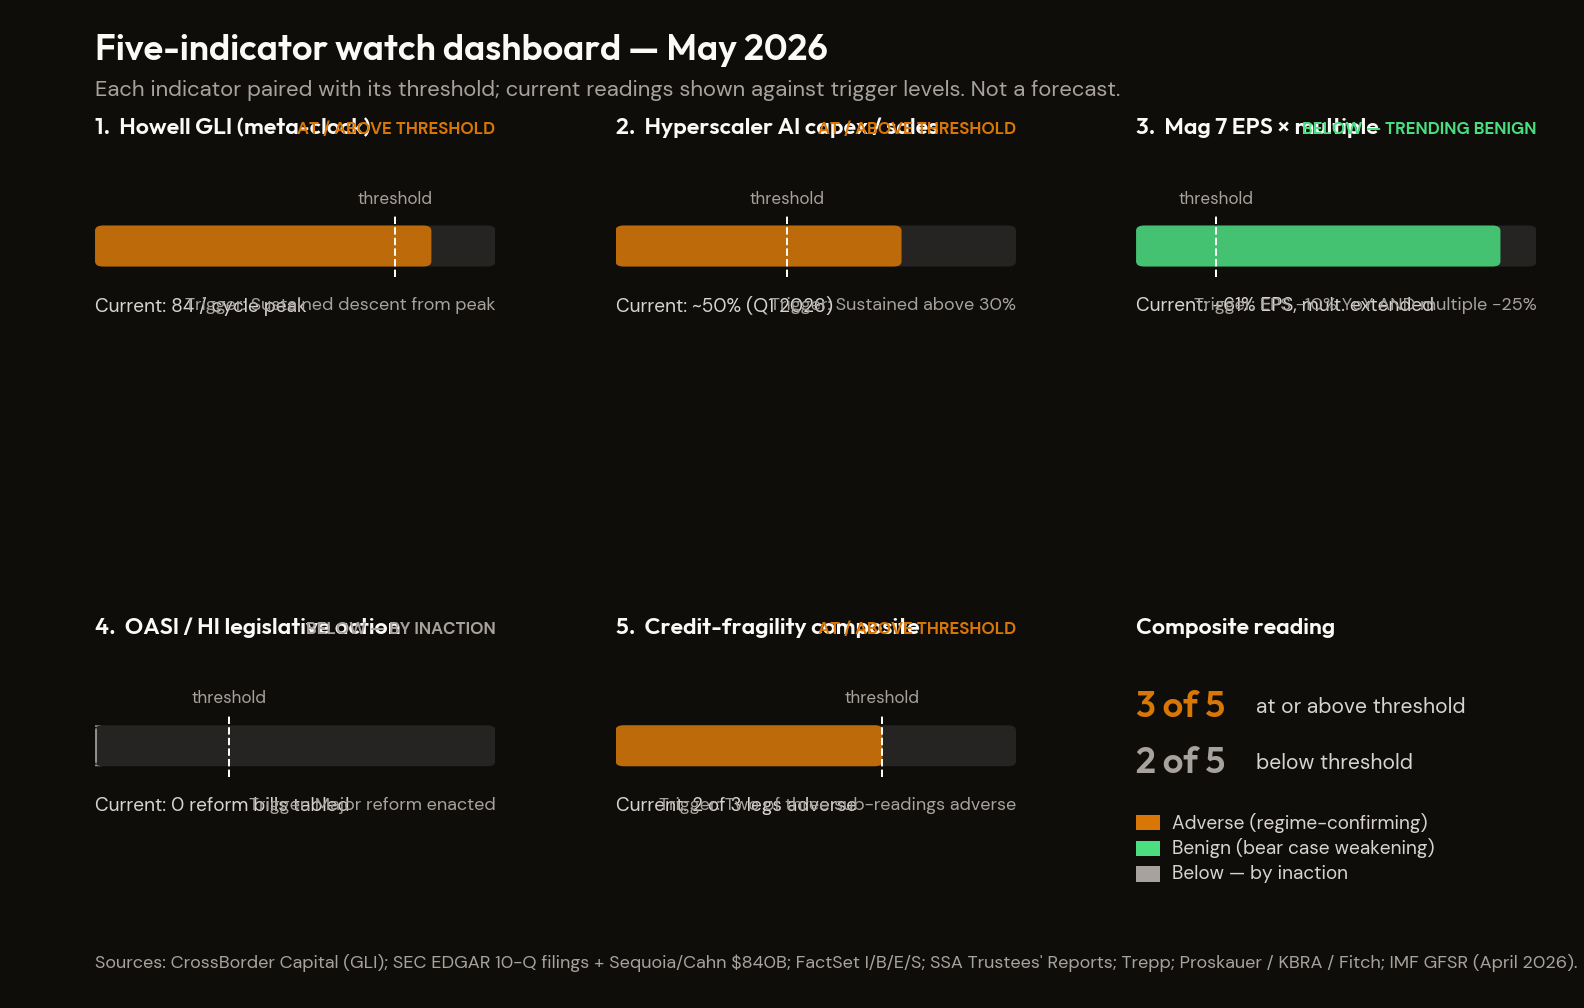
The prose walkthrough of each indicator follows. Each pairs an essay-of-origin tag, a primary-source URL, a current reading, a threshold condition, and a falsification condition. The dashboard is asymmetric. As of May 2026, three of the five indicators sit at or near threshold; two sit clearly below. The asymmetry is the dashboard's honest reporting, not an editorial choice.
Indicator 1 — Howell Global Liquidity Index (the meta-clock)
Primary source: CrossBorder Capital Global Liquidity Index, published monthly on the Capital Wars Substack.4 Essay-of-origin: Essay 12, §IV.
The index aggregates central-bank balance sheets, private-sector credit creation, and cross-border funding flows into a single composite series. It is the operational expression of Howell's 65-month cycle — the cycle whose duration approximately matches the average global debt maturity profile, which is the structural reason a cycle of that length exists at all.
Current reading: index past peak (early-2026); confirmed but not yet sustained post-peak descent.
Threshold condition: descent from the early-2026 peak sustained across three consecutive monthly readings confirms the Speculation-to-Turbulence transition. The first leg of the threshold is satisfied; the sustained three-month confirmation is the analytical move.
Falsification condition: if the index re-accelerates above its early-2026 peak on a sustained three-month basis, the cycle has not peaked and the watch-window timing thesis requires updating.
The meta-clock is the structural reason the other four indicators acquire their convergence weight. A descent in the Howell index without sub-reading corroboration is consistent with a one-off liquidity adjustment; the descent with multiple sub-readings approaching their thresholds in the same window is the regime signal.
Indicator 2 — Hyperscaler AI capex / sales ratio
Primary source: SEC EDGAR per-company 10-Q filings for Microsoft, Alphabet, Amazon, and Meta, aggregated against company-reported revenue.5 Essay-of-origin: Essay 4 (AI Reckoning).
The capex-to-sales ratio reads the AI capex internal clock from the source-data side rather than the revenue-gap side. The framework's question is whether the hyperscaler capex deployment is sustainable on the cash-flow base that has to fund it.
Current reading: 2026 combined hyperscaler capex guidance approximately $700–725 billion against AI-attributable revenue running ~$50 billion. The Cahn arithmetic (Sequoia, locked at $840B verbatim per the 2025 update) puts the implied annual revenue threshold at roughly 16× current run-rate to justify the capex at a 50% margin / 50% ROIC hurdle.6 Capex as a share of combined hyperscaler sales has been rising across 2024 and 2025; the Q1 2026 reading is the most extended point in the modern series.
Threshold condition: hyperscaler aggregate capex/sales ratio sustained above its 10-year historical norm by 2x for two consecutive quarters AND aggregate capex at or above $750 billion annualised. The conjunction closes the pick-one trap from the cash-flow side: capital that funded the AI build cannot find an internal funding source that justifies the sustained investment.
Falsification condition: AI-attributable revenue per major hyperscaler crossing $100 billion annually on a sustained growth trajectory, indicating productivity returns are materialising at a scale sufficient to close the Cahn gap without sovereign-debt competition or balance-sheet stress.
Indicator 3 — Mag 7 forward EPS revisions
Primary source: FactSet Earnings Insight (I/B/E/S consensus).7 Essay-of-origin: Essay 4 (The AI Reckoning).
The indicator is the falsification condition for Essay 4's bear case at the equity-valuation level. Essay 4 is built on a multi-channel argument — valuation, concentration, revenue-base concentration through consumer K-shape, mechanical-bid amplification. The bear case stands on the joint behaviour of earnings AND multiple, not on either alone. The indicator reads that joint behaviour as a conjunction, and the discipline is to state the conjunction in advance so the dashboard cannot be re-interpreted at signal arrival.
Current reading: Mag 7 Q1 2026 blended earnings growth at +61% YoY, substantially above the March 31 consensus expectation of +22.4%. S&P 500 full-year 2026 EPS growth estimate 23%, up from below 16% at January 1 consensus. Forward estimates for Q2 2026 rose +2.1% in April — the largest first-month-of-quarter increase since Q2 2021. The multiple sits at extension; the EPS is strong; the joint condition is not currently falsifying in either direction.
Threshold condition (conjunction, bear case strengthening): BOTH (a) Mag 7 blended forward EPS revisions turning negative on a -10% YoY basis AND (b) multiple compression in excess of 25% from current extension, sustained across two consecutive quarters. Either leg alone is consistent with idiosyncratic single-channel stress; the joint movement is the regime signal.
Falsification condition (conjunction, bear case falsified): BOTH (a) Mag 7 EPS revisions holding or accelerating (positive YoY) AND (b) the multiple expanding rather than compressing, sustained across two consecutive quarters. Strong EPS alone does not falsify; strong EPS with multiple expansion does. Both legs have to move benign before the bear case loses this indicator — and the conjunction is stated here, in advance, so the dashboard cannot retreat to "the other axis remains intact" once one leg moves against the call.
The indicator is the one the dashboard's no-prediction discipline requires stating plainly. The earnings leg is currently moving strongly against the bear case; the multiple leg has not moved with it. The bear case on this indicator is not yet falsified — but the conjunction is stated, and the dashboard is committed to acknowledging falsification cleanly when both legs move benign together.
Indicator 4 — OASI / HI legislative action
Primary source: Social Security Administration Trustees' Reports; CBO long-term projections; legislative calendar tracking via congress.gov.8 Essay-of-origin: Essay 1 (The Math Doesn't Work).
The OASI and HI trust-fund depletion dates establish a binary trigger. Either Congress legislates a fix on the political calendar that allows ordinary legislative process to operate — multi-year hearings, bipartisan compromise, gradual phase-in — or the trust funds reach insolvency and the cuts become automatic. The political calendar is mechanical: the OASI depletion date is in the early 2030s on current Trustees' projections; the legislative-action window is therefore the 2026–2028 watch window, by simple arithmetic on the lead time required for an ordinary fix.
Current reading: no major OASI / HI reform legislation tabled in the current Congress; technical fixes only; the fiscal-arithmetic problem has not been engaged at the statute level.
Threshold condition: the 2026 mid-terms and the 2027 legislative session pass without major OASI / HI reform legislation tabled and advanced through committee. The binary tightens with each unfit window.
Falsification condition: major OASI / HI reform legislation enacted, with phased implementation beginning in 2026 or 2027, sufficient to push depletion dates outside the 2026–2030 stress window.
The indicator earns its dashboard slot because it is the cleanest available test of whether the democratic system can act on the diagnosis before the crisis forces the action. It is binary because the legislative process is binary: a fix exists, or it does not.
Indicator 5 — Credit-fragility composite
Primary sources: (a) Proskauer Private Credit Default Index; KBRA Private Credit Surveillance Compendium; Fitch Ratings private-credit default tracker.91011 (b) Trepp CMBS Delinquency Tracker (monthly).12 (c) Redemption-squeeze frequency in semi-liquid private-credit vehicles, tracked through quarterly fund disclosures and IMF GFSR reporting on the semi-liquid stock.13 Essay-of-origin: Essay 12 (Cracks).
The composite combines three signals that read the same underlying credit-fragility configuration through different channels. Reading them as a composite is the analytical move; reading any one alone is the diagnostic mistake the prior essay warned against.
Current readings:
- Private-credit "bad PIK" shadow default rate at 6.4% (Q1 2026); Fitch trailing-twelve-month at 5.8% (January 2026); Proskauer headline 2.73% (Q1 2026), up from 2.46% (Q4 2025).
- Office CMBS delinquency at 11.71% (March 2026), down from peak of 12.34% (January 2026 — all-time record, meaningfully above the 2008 crisis peak of approximately 10.7%).
- Redemption-squeeze frequency in semi-liquid private-credit vehicles: the IMF April 2026 GFSR documents approximately $300 billion in semi-liquid private-credit structures subject to retail redemption, with quarterly disclosures from major sponsors showing rising gate utilisation across 2025.
Threshold condition: composite trigger — any two of (a) bad PIK shadow rate above 7%, (b) office CMBS delinquency above 15%, (c) semi-liquid private-credit gate utilisation crossing the 25% threshold on a sustained quarterly basis — confirms the credit-fragility leg of the regime claim. The conjunction is the analytical move: any one indicator alone is consistent with idiosyncratic stress; two crossing simultaneously is the structural signal.
Falsification condition: sustained reversion across all three legs — shadow default rate below 3%, office CMBS delinquency below 8%, semi-liquid gate utilisation below 5% — confirms the credit fragility has been successfully resolved through amend-and-extend rather than crystallised through loss recognition.
The composite is the dashboard's densest signal because the three legs are connected by the insurance-mediation channel Essay 12 §V documents. Stress in any leg transmits to the others through shared collateral and shared marginal buyers. Two simultaneous threshold crossings indicate the transmission is operating, not that two independent stress events have arrived.
III. Cross-Indicator Convergence
A single indicator crossing its threshold is a data point. Two indicators crossing simultaneously are a regime signal — the same underlying condition expressing itself through independent channels. The significance is not additive; it is the co-movement signal Essay 12 identifies as the structural precursor to phase transitions.
Time-structure matters. Sequential threshold crossings — one indicator crossing, then another months later, then a third — provide less regime confirmation than simultaneous crossings, because sequential crossings are individually consistent with idiosyncratic stress in each indicator's source mechanism. The analytical question the dashboard asks in real time is not just has any indicator crossed but are the crossings clustering in time.
Three specific convergence cases are worth developing in detail.
Convergence A — meta-clock plus credit-fragility composite. Indicator 1 (Howell index in sustained post-peak descent) AND Indicator 5 (credit-fragility composite at any two of three legs). Joint signal: the master liquidity vector is contracting at exactly the moment the credit-fragility legs that couple most tightly to it (private credit through the insurance-mediation channel, CRE through the regional-bank channel, semi-liquid private credit through retail-redemption gates) are losing their amend-and-extend optionality. This is the cleanest co-movement reading the dashboard can produce because the coupling is structural rather than coincident: collateral-cascade procyclicality in the credit complex is the mechanism by which the liquidity contraction transmits to recognised loss. As of May 2026, the Howell descent is confirmed but not yet sustained across three monthly readings; the credit-fragility composite has one of three legs near threshold and a second leg trending. The configuration is pre-convergence.
Convergence B — capex/sales plus EPS × multiple conjunction (the pick-one trap closing). Indicator 2 (hyperscaler capex/sales sustained at 2x its 10-year norm AND aggregate capex at or above $750B annualised) AND Indicator 3 on the bear-conjunction side (Mag 7 EPS revisions turning negative on the -10% YoY threshold AND multiple compression in excess of 25%, both sustained across two consecutive quarters). Joint signal: AI capex at the most extended point in its modern series, with the funding base for that capex contracting at the earnings level AND the multiple compressing — the pick-one trap from The AI Reckoning closing from both sides simultaneously. The current configuration has Indicator 2 at its most extended point and Indicator 3's earnings leg moving strongly in the opposite direction from the bear conjunction. The configuration is far from convergence on this pair.
Convergence C — meta-clock plus OASI / HI legislative inaction. Indicator 1 (Howell index in sustained descent) AND Indicator 4 (no major OASI / HI reform legislation tabled through 2027). Joint signal: the structural fiscal-arithmetic constraint is binding at exactly the moment the liquidity vector contracts. The Fed cannot fix what Congress will not legislate; the legislative window has a calendar; the meta-clock has a calendar; the two calendars overlap in the watch window. The Indicator 4 condition is currently met (no major reform tabled) and the binary tightens by default as the window narrows. The pairing is on its way to threshold by inaction rather than by event.
The convergence cases establish what to watch for when the dashboard activates. The harder discipline is the inverse: what would have to be true for the entire watch-window thesis to be wrong? That is the next section's question.
IV. What Would Falsify the Watch Window Thesis Entirely
Each indicator in §II carries its own falsification condition — the reading that would falsify that specific indicator's analytical claim. The question here is different: what would falsify the watch-window thesis entirely, not indicator-by-indicator but at the regime level?
The primary falsification scenario is structural, not incremental: the Fed pivots and it works. Specifically, the Fed cuts rates in 2026–2027 and the velocity-collapse condition the Hunt framework names reverses on a sustained basis — money begins to circulate at a rate consistent with monetary transmission to the real economy operating again. That would mean the watch-window's central architectural premise — that the backstop is asymmetric precisely when it is most needed — is incorrect. Not adjustment. Revision. The Hunt-Howell combination Essay 12 §X names describes a system in which the liquidity cycle peaks at exactly the moment the traditional emergency response has lost its growth-generating effectiveness. If Hunt is wrong on the asymmetry, the entire timing thesis requires updating.
A secondary falsification scenario operates on a different mechanism: hyperscaler AI-attributable revenue per major company crosses $100 billion annually on a sustained growth trajectory. If AI productivity returns materialise at a scale sufficient to justify the capex without sovereign-debt competition, the forced-choice clock stops ticking on the AI side. The current readings place Microsoft AI business at approximately $37B annualised and Amazon AWS AI-related chip revenue above $20B annualised. The threshold for this falsification is approximately three times those levels for the leading hyperscaler, with sustained quarter-over-quarter growth in a band consistent with the capex-revenue ratio approaching parity.
A third secondary falsification scenario operates on the cross-essay motif the diagnostic block has traced — the mechanical-bid reversal that the demographic curve underneath the asset-price regime imposes. The condition is structural: fertility rates in major economies rebound above replacement on a sustained basis (2+ years of data) OR mass-immigration policy produces net-positive labour-force growth sufficient to offset the Boomers' RMD decumulation curve. If demographic headwinds reverse on either mechanism, the mechanical-bid reversal The End of the Bull Run and The Demographic Crunch document is partially mitigated. This is not a 2026–2027 watch-window condition; demographic reversal operates on a multi-year horizon. It belongs in the falsification framework because the regime claim is conditional on the demographic curve being intact, not because the dashboard can confirm or deny it inside the window itself.
These are the conditions that would require revision of the regime claim — not of one indicator, but of the posture the entire manuscript's diagnostic block has built. The final question is not what would falsify it, but what to do with conflicting signals in real time, before the primary or secondary falsification conditions are fully met or fully refuted.
V. Reading the Clocks Honestly
The dashboard does not tell you what you want to hear. It tells you what the hands are showing. Hold the composite signal, not the most convenient individual signal. Read all five indicators as a system. Maintain the regime claim while the structural conditions that generated it remain intact; revise it when those structural conditions are themselves disconfirmed at the dashboard level, not when one indicator tells an inconvenient story while the others confirm the architecture.
The clocks read what they read. The next question is what to do with the reading — not prediction, but posture. The Survival Framework takes it from here.
Footnotes
-
Yaneer Bar-Yam and the New England Complex Systems Institute working-paper record on cross-equity co-movement as a criticality signature, available via the NECSI publications portal. Bar-Yam published working papers on this co-movement metric in 2007 and 2008 (NECSI). Bar-Yam, Making Things Work: Solving Complex Problems in a Complex World (NECSI Press / Knowledge Press, 2004) develops the conceptual frame. ↩
-
Philip E. Tetlock and Dan Gardner, Superforecasting: The Art and Science of Prediction (Crown Publishers, 2015). ISBN 9780804136716. Penguin Random House. ↩
-
Nassim Nicholas Taleb, "Antifragility, Robustness, and Fragility Inside the 'Black Swan' Problem," working paper: arxiv.org/abs/1108.1119. The h″(x) < 0 fragility formulation is elaborated mathematically in the paper and in the Technical Appendix of Antifragile: Things That Gain from Disorder (Random House, 2012). ↩
-
CrossBorder Capital — Global Liquidity Index, Capital Wars Substack (monthly). ↩
-
SEC EDGAR — per-company 10-Q filings: MSFT, GOOG/GOOGL, AMZN, META. ↩
-
Proskauer Private Credit Default Index — Q1 2026 rate at 2.73%. ↩
-
KBRA — Private Credit Q3 2025 Middle Market Borrower Surveillance Compendium. ↩
-
Fitch Ratings — US Private Credit Default Rate Continues Upward March to 5.8% in January 2026 (February 2026). ↩