The AI Reckoning
In 60 seconds
Seven names are 31% of the S&P 500 and derive ~71% of revenue from the US consumer on look-through. The capex underwriting their valuations — $725B of hyperscaler AI spend in 2026 — requires $840B of annual AI revenue against $50B observed: a 16× gap. Acemoglu brackets the productivity ceiling at 0.66% TFP over a decade; Goldman's own desk has quietly de-rated to "basically zero" for 2025. Brynjolfsson finds AI-exposed workers aged 22–25 down 13%. The Mag 7 cannot simultaneously be priced for AI hyper-growth and protected from labour-market disruption. Pick one.
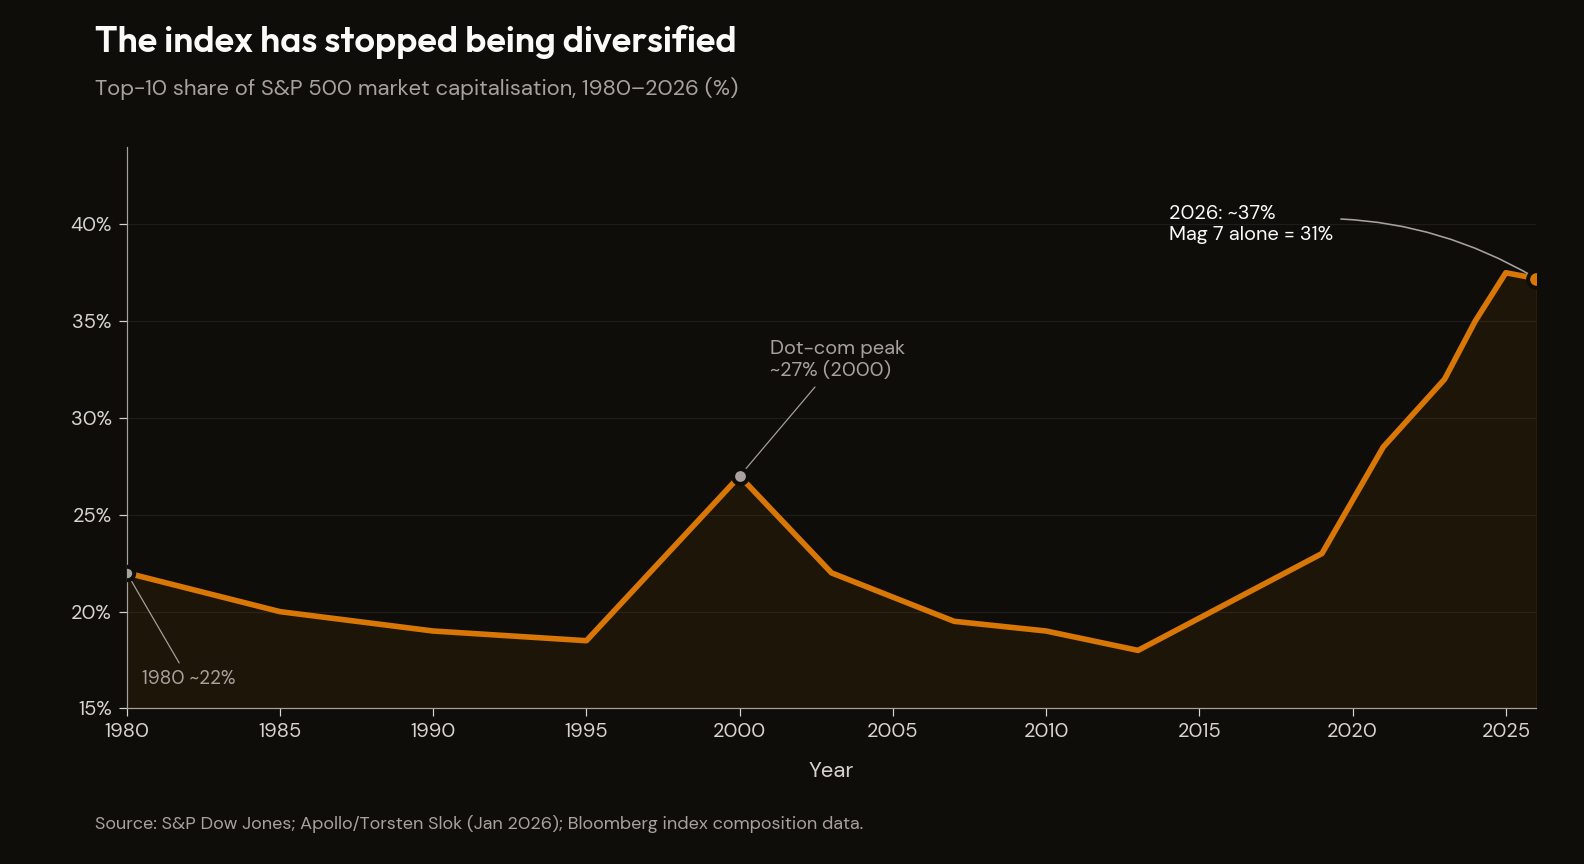
The S&P 500 has stopped being a diversified index without anyone updating the marketing copy. The seven largest stocks — Apple, Microsoft, Alphabet, Amazon, Nvidia, Meta, and Tesla — accounted for roughly 31% of total market capitalisation by the end of 2025.1 The top ten names combined sat above 40%. As Apollo's Torsten Slok told Fortune in July 2025, "the textbook idea that the S&P 500 gives you a diversified exposure to risk is just simply no longer the case."2
The conventional response — that concentration in seven exceptional businesses is a feature rather than a bug — relies on a particular assumption: that those seven businesses are seven different bets. They are not. They are one bet wearing seven costumes, and the bet is on the continued spending power of the United States consumer, plus a wager on artificial-intelligence productivity gains that, on three independent constraints, cannot arrive in the form the multiple requires.
In every previous cycle where a single technology category absorbed roughly three percent of US GDP in capital expenditure, the cycle ended in capital destruction. The 1860s railroads, the 1920s electric utilities, and the 1996–2000 telecom build-out each crossed that threshold; each terminated in a wave of receiverships, write-downs, and equity wipeouts that took the financiers, if not the infrastructure, with them. By 2026, hyperscaler AI capex is approaching the same threshold. Aggregate 2026 guidance sits at approximately $725 billion against a US GDP of roughly $30 trillion — between 2.4% and 2.5%. By 2027 it will, on current guidance, exceed 3%.
This essay traces the consumer base and the capex commitment together, because they are the same problem viewed from opposite ends. The conclusion, stated up front so the rest of the argument can be examined against it: the AI capex program is being underwritten by an earnings story the consumer cannot deliver, against a productivity ceiling the academic literature says cannot be reached, into a commoditisation curve that is collapsing pricing power before scale is recouped. Three independent constraints. All pointing the same direction. Pick one.
I. The Concentration
The 2025 narrative that the Mag 7 are diversified across different businesses survives because few investors examine it carefully. Apple sells phones. Microsoft sells enterprise software. Alphabet sells search advertising. Amazon sells everything. Nvidia sells AI chips. Meta sells social-network advertising. Tesla sells electric vehicles. Seven businesses; seven moats; seven stories.
Then look at the revenue mix.
| Company | Q1 2026 revenue ($B) | % consumer-direct | % advertising-adjacent | % enterprise | Hidden consumer exposure |
|---|---|---|---|---|---|
| Apple | 143.8 | ~100% | 0 | 0 | iPhone 59% of total |
| Microsoft | 82.9 | ~16% | 0 | ~84% | Genuine enterprise (the exception) |
| Alphabet | 109.9 | ~12% | 82% | ~18% (Cloud) | Search/YouTube ad model = consumer attention |
| Amazon | 181.5 | ~57% | 9% | ~21% (AWS) | Marketplace + Prime |
| Nvidia | 57.0 | <10% | 0 | ~90% | 4 customers >10% each are hyperscalers monetising consumers |
| Meta | 56.3 | 0 | 98% | <1% (Reality Labs) | Ad model = consumer attention |
| Tesla | 22.4 | 88% | 0 | 12% (energy/credits) | Automotive 69% |
| Aggregate | ~654 | ~46% | ~25% | ~30% | ~71% consumer on look-through |
Apple's Q1 fiscal 2026 produced $143.8 billion of revenue, of which essentially every dollar came from consumers — iPhone alone generated $85.3 billion (59% of total), with Services, Wearables, Mac, and iPad accounting for the rest, and no enterprise division of meaningful size.3 Meta's $56.3 billion came 98% from advertising; Reality Labs added $0.4 billion.4 Meta's advertisers are businesses, but its product is consumer attention — when P&G buys advertising from Meta, what P&G is willing to pay is determined by what Meta's users are willing to spend on P&G's products. Tesla's $22.4 billion was 88% consumer-driven: $15.5 billion of automotive sales, $3.75 billion of services.5 Alphabet is, by revenue, a 4-to-1 consumer business with an enterprise software business as a side hustle: $109.9 billion total, $89.6 billion (82%) from advertising plus $12.4 billion from consumer subscriptions, devices, and Play Store fees, against $20 billion from Google Cloud.6 Amazon comes in at roughly 78% consumer-driven across first-party retail, Prime, Whole Foods, third-party seller services, and advertising; AWS, at $37.6 billion, is the only meaningful enterprise contribution.7
Microsoft is the meaningful exception. Roughly 84% of its $82.9 billion in Q3 fiscal 2026 came from enterprise — Office 365 Commercial, Azure, server products. The More Personal Computing segment accounts for the consumer share.8 Microsoft is genuinely a different business from the other six.
Nvidia is the seventh and the trickiest. By invoice, 90% of Nvidia's $57 billion in Q3 fiscal 2026 came from data-centre chips sold to enterprises. But the customer disclosure tells a different story on look-through. Two unnamed customers accounted for 36% of fiscal 2026 revenue; four customers each individually exceeded 10%.9 Bloomberg has identified them as Microsoft, Meta, Amazon, and Alphabet. Setting aside Microsoft, the other three derive their revenue from consumer activity. The cash that flows into Nvidia's coffers begins with a consumer paying attention to advertising or buying something on Amazon, gets converted into ad dollars or marketplace fees, then into the hyperscaler's operating cash flow, then into AI infrastructure investment, then into chips Nvidia sells. Strip out the consumer at the bottom and the chips at the top stop selling.
Aggregate the seven. On a revenue basis, Q1 2026 Mag 7 revenue totalled approximately $654 billion. Treating Nvidia conservatively as enterprise — despite the look-through argument above — consumer-direct and consumer-adjacent revenue totals $465 billion. That is roughly 71% of total Mag 7 revenue. Apply the look-through to Nvidia's data-centre segment and the figure rises to about 77%.
These percentages settle a question that has been debated in equity research for several years: are the Mag 7 a play on enterprise software, or on the consumer? The answer is the consumer, by something better than two-to-one. The seven names that constitute 31% of the S&P 500's market capitalisation derive roughly two-thirds of their revenue, on a look-through basis, from a single source: the United States consumer's willingness and ability to spend money. The point is not that consumer revenue is bad. The point is that the Mag 7, taken together, represent something the index has never previously contained: a consumer-revenue concentration risk roughly the size of the entire post-1970 average S&P 500 weight. When the consumer pulls back, the diversified index does not catch the fall — because the index has stopped being diversified.
II. The Consumer Reality and the Wage Compression
If the Mag 7's growth requires consumer spending power, it is worth asking what shape consumer spending power is currently in. The Math Doesn't Work — the first essay in this manuscript — laid out the household-balance-sheet floor in detail. The headline data the present essay needs in compressed form: a 3.6% personal savings rate at multi-decade lows (against a pre-COVID 6% to 8%);10 total US household debt at $18.36 trillion, with credit card balances at $1.28 trillion all-time highs and a "broad, continuing rise" in delinquencies through 2025 with no indication of cyclical normalisation;11 subprime auto 60-plus-day delinquencies at 6.9% in January 2026, near a 30-year series high, against a prime rate of 0.4% — a seventeen-to-one bifurcation, the widest in modern data.12 That work establishes the floor. This section establishes the link from the floor to Mag 7 revenue, and from Mag 7 revenue to the labour market.
The aggregate hides a K-shape. Research from the Dallas and Minneapolis Fed banks documents that from Q3 2020 to Q3 2025, household spending in the top decile grew nearly twice as fast as spending in the rest of the distribution; lower-third cardholders' spending actually contracted in mid-2025 and remained nearly flat into 2026.13 The top 20% of households now accounts for approximately 57% of total US personal consumption expenditure.14 The bottom 60% of households contribute less to aggregate consumption than the top quintile alone. Stephanie Pomboy has pressed on the same K-shape framing for several years, describing the post-COVID expansion as one in which the top decile is the economy.15 To a first approximation, the US consumer economy has become a story about the upper-middle class.
That cohort — the top quintile of US households — is the cohort that buys iPhones, subscribes to Apple One, joins Amazon Prime, drives Tesla Model 3s, and produces the engagement that Meta and Alphabet monetise. As long as the upper-middle class keeps spending, the Mag 7 keeps growing. The Mag 7 revenue base is the K-shape.
The bifurcation cuts in two directions for the Mag 7 thesis. On one hand, the spending that drives Mag 7 revenue comes disproportionately from this top quintile, and the top quintile has been the resilient part of the consumer economy through 2024 and into 2025. On the other hand, the same data identifies the precise vulnerability the Mag 7 cannot afford. The top quintile is the cohort exposed to the labour-market shock currently unfolding — the wage compression that is the structural mechanism of this section.
The standard narrative about the US labour market in 2025 and 2026 has been one of resilience: headline unemployment below 5%, real average hourly earnings up 0.3% year-over-year, median weekly earnings outpacing CPI.16 Observed from the helicopter, the labour market looks like a soft landing in progress. Walk down to ground level and the picture changes.
The Federal Reserve Bank of Atlanta publishes the Wage Growth Tracker, the most carefully constructed measure of wage growth in the US economy. The tracker separates wage growth for workers who stay in their jobs ("stayers") from workers who switch employers ("switchers"). Historically, switchers earn a substantial premium for changing jobs — typically 0.5 to 1.5 percentage points higher than stayers. This premium is the labour market's price signal that workers have power. For approximately six consecutive months between February and August 2025, the Atlanta Fed Wage Growth Tracker showed stayer wage growth equal to or exceeding switcher wage growth. The premium inverted. In July 2025 specifically, stayers grew wages at 4.1% while switchers grew at 4.0%.17 This configuration has appeared exactly twice before in the modern data series: during the Great Recession (February 2009 to July 2010, eighteen months) and during the dot-com bust. It has now appeared a third time, without an officially recorded recession.
Revelio Labs documented the dollar version. They found that 40% of white-collar workers who switched jobs at the end of 2025 accepted nominal salary cuts of more than 10%. The share of white-collar switchers receiving double-digit raises had fallen from approximately 54% at the 2022 peak to 41% in 2025. White-collar job postings collapsed by 35.8% over two years.18 For two-fifths of white-collar workers who took a new job in 2025, the new job paid materially less than the old one. Not by a few points. Not by inflation. By more than 10% in nominal terms.
The supporting evidence corroborates the picture. Indeed's Wage Tracker, which measures advertised wages on new job listings, decelerated through 2025 to the point where CPI was outpacing the Indeed reading. ZipRecruiter's 2025 Annual Employer Survey found the majority of employers had kept base pay flat for new hires; the firm's 2026 prediction document is titled The Great Freeze. ADP's Pay Insights showed the switcher premium compressed to 1.9 percentage points in January 2026, the smallest gap in the series. The New York Fed's Survey of Consumer Expectations showed job satisfaction with wage compensation at its lowest reading since the series began in March 2014; the expected likelihood of moving to a new employer at the lowest since March 2021; job-finding expectations at a series low in January 2026.19 Workers are responding by not switching jobs at all, because doing something is now financially worse than doing nothing.
The underlying mechanism is structural rather than cyclical. Brynjolfsson, Chandar and Chen's Stanford Digital Economy Lab disaggregation found that in the most AI-exposed occupations, early-career workers aged 22 to 25 experienced a 13% relative employment decline between late 2022 and mid-2025, even controlling for firm-level shocks. In the same occupations, workers aged 30 and over saw employment grow by 6 to 8%. In occupations not exposed to AI, every age cohort moved together.20 The qualification I owe on first reference: the Stanford finding is one identification strategy on one dataset, and it is the strongest single piece of empirical work on AI labour displacement currently published. It has not yet been replicated against BLS or other primary series. The manuscript treats it as directional rather than settled — but the direction is what the rest of the argument turns on.
The signal is not that AI is replacing the workforce. It is that AI is replacing entry. The Federal Reserve Bank of New York's Q1 2026 underemployment series for recent college graduates — 41.5% to 42.5%, against a pre-pandemic baseline near 32% — confirms the pattern from a different dataset. Software engineering job postings, on Indeed's tracker, are running at roughly two-thirds of their 2020 baseline. Revelio Labs documented the corporate side: in 2015, US strategy consulting firms hired roughly four junior analysts for every one AI engineer. By 2025, AI roles outnumbered junior analysts at the major firms. The bottom rung of every white-collar ladder — junior analyst, paralegal, entry-level developer, first-year associate — is the precise tier the Mag 7's products substitute for first.
This tightens the dependency loop one more turn. The K-shape consumer story requires the top quintile to keep earning. The pipeline that replenishes the top quintile — the white-collar entry job — is the pipeline AI is severing. Senior cohorts retain pricing power; juniors do not. The Mag 7 are simultaneously the suppliers of, and the most exposed to, an AI-driven attrition of their own future customer cohort.
The Mag 7 themselves are framing layoffs as AI productivity trades rather than cyclical responses. In Q1 and Q2 of 2026, the seven companies announced approximately 32,000 cuts.21 The framing in earnings calls was instructive. Microsoft's CFO said headcount would decline for the year. Meta's CEO described the productivity gain on the Q1 2026 earnings call: "we're seeing more and more examples where one or two people are building something in a week that would have previously taken dozens of people months."22 None of these companies described the cuts as a response to weakening demand for their products. The companies that derive roughly 70% of their revenue from consumer-facing activity were laying off white-collar workers because the AI tools they were building had reduced their need for those workers. They were, in a precise sense, reducing the disposable income of their own future customer base.
Goldman's own macroeconomics desk has produced the cyclical bookend. Jan Hatzius's view as of Q1 2026 is that AI added "basically zero" to 2025 US GDP — the imported-chips / domestic-displacement asymmetry, in his framing: AI capex flows out to imported semiconductors (Taiwan, South Korea) while displacement of US workers compresses domestic consumption.23 He projects a contribution rising to 0.3 to 0.7 percentage points by 2027 if adoption continues. That is meaningful. It is not transformative. The bullish house has, on the macro side at least, walked the projection down to roughly one-tenth of its 2023 published number.
This wage compression is the cohort-level expression of the macro mechanism The Demographic Crunch identified: the labour-supply tailwind that suppressed wages and supported asset prices for forty years has reversed. What that essay described at the level of working-age population peaks and asset-deflation regimes, this section is observing at the level of individual workers and individual paychecks. The macro reversal is the structural anchor; the wage data is the cohort-level signature. And the same white-collar cohort whose displacement is severing Mag 7 revenue is the cohort whose wage taxes fund the marginal share of federal receipts. Cohort-level wage compression is fiscal-arithmetic compression on a delay — the payroll-tax thread The Math Doesn't Work traced runs through here as well.
III. The Structural Mechanism — Mechanical, Not Informed
A natural question follows: how does the concentration sustain when the underlying consumer base is weakening? The conventional answer is some version of "the largest seven are the best seven, so flows find them on the fundamentals." The structural answer is sharper. The bid is mechanical, not informed.
In Green's July 2025 framing, a passive flow of $1 into an S&P 500 index fund produces price impact in the top Mag 7 names on the order of $100 — multipliers in triple digits.24 The mechanism is not informed bidding; it is forced bidding. The flow does not care what Nvidia earns. The flow cares that Nvidia is in the index, and the flow has to own the index.
The empirical backing is Jiang, Vayanos, and Zheng's formal model: when a passive fund receives a dollar of inflow, it purchases each constituent in proportion to its existing weight, and the marginal price impact is determined by the elasticity of active demand rather than firm-level supply.25 As passive ownership has grown to majority share of US equity AUM, the active counterweight has thinned. The effect is largest in the largest names by construction — those names are the largest by index weight, the largest fraction of every passive purchase, and the names where active investors have most reduced their over- and under-weights relative to benchmark. Concentration is amplified by the flow regime that purchases it; the flow regime is itself concentrated in the names whose mechanical bid is largest.
This is the chapter's anchor for what the manuscript elsewhere calls the mechanical, not informed observation. The Mag 7's price is not the result of distributed informed judgment about future cash flows. It is the result of a flow regime — passive index ownership crossed with target-date fund auto-enrollment crossed with 401(k) default contributions — that buys mechanically on the way up. The same flow regime sells mechanically on the way down. When the consumer impairment described in §II turns into Mag 7 revenue impairment, the mechanical bid does not catch the fall. It reverses.
There is a second-order consequence worth naming. Because the mechanical bid does not depend on informed judgment about fundamentals, its supportive effect is largely insensitive to the deterioration in those fundamentals — until it is not. The empirical pattern in inelastic-markets regimes is non-linear: the bid persists until flows turn, and when flows turn the mechanism unwinds at roughly the same rate it wound up. The 2018 Q4 selloff and the 2020 Q1 COVID collapse both showed elements of this pattern: large mega-cap drawdowns on a timescale that was inconsistent with the slow accumulation of fundamental information and that was consistent with reflexive flow-driven liquidation. The Mag 7 has been the recipient of approximately three years of accelerating mechanical bid since the late-2022 lows. The reverse leg of that mechanism is not in the historical sample at the same concentration.
The connection between §I, §II, and §III is the load-bearing structural claim of this chapter. The concentration is real on the fundamentals. The consumer base underlying the fundamentals is weakening. The flow regime that values the concentration is mechanical rather than informed, which means it amplifies the concentration even as the underlying base erodes — and which means the unwind, when it arrives, is symmetric with the wind-up. Howard Marks, anchored in The End of the Bull Run, has framed this risk through his SPY-put position sizing: Oaktree increased its SPY put exposure by 200% in Q2 2025, to $388 million, which at quarter end was the second-largest position in the disclosed portfolio. The manuscript's voice anchor for the marks/valuation/multiple-compression thread is The End of the Bull Run and The Survival Framework; the relevance here is structural — Marks's actions, not his rhetoric, are calibrating to the mechanical bid he can identify but cannot precisely time.
IV. The Spend
The size of the commitment is the next thing to settle, because everything downstream turns on it.
In 2024, the combined Mag 7 capital expenditure was approximately $240 billion, of which roughly two-thirds — call it $160 billion — was AI-related infrastructure. By the end of 2025, run-rate capex had climbed to about $425 billion. The 2026 guidance, aggregated from Q1 earnings calls and Bloomberg's hyperscaler tracker, sits at approximately $725 billion across Microsoft, Amazon, Alphabet, and Meta, with the AI share now north of 80%.26 27 Bloomberg's cumulative 2026–2030 estimate is $3.0 to $3.5 trillion. Nvidia, the principal beneficiary, reported $44.1 billion of revenue in fiscal Q1 2026 and $57 billion in fiscal Q3 — an annualised pace of roughly $228 billion, of which 88% to 90% comes from the data-centre segment.28
Express the capex as capex-to-sales ratios and the picture sharpens. The hyperscalers are running capex/sales at levels historically associated with utilities — 20–30% of revenue, in some quarters higher — on software-multiple companies that the market is still valuing on software-margin economics. Amazon is projected to swing FCF-negative in 2026 as the spending crosses operating cash flow. The financing is increasingly bond-funded at the supplier-ecosystem layer; utilities, data-centre REITs, semiconductor fabs, and sovereign-backed export credit are raising the capital the hyperscalers cannot fund from operations alone. Sovereign capital has become the buyer of last resort: UAE and Saudi commitments now exceed $100 billion, layered on top of the hyperscaler stack.
Express it as a share of GDP, and the historical analogue does the explaining for you. US railroads in the late 1860s peaked above 5% of GDP at the height of the post-war build-out; the 1873 panic followed, and by 1876 more than a quarter of US rail mileage was in receivership. The 1920s electrical and utility build-out reached approximately 2.5% to 3% of GDP at peak. The structurally identical historical comparison, however, is none of these. It is the telecom and fibre over-build of 1998 to 2001, which peaked at roughly 3% of GDP. Approximately $2 trillion of equity value was wiped out between 2000 and 2002. Industry analysts estimated that 95% of long-haul fibre laid during the boom was dark — unused — by 2002. The infrastructure eventually got used. The capital that funded it did not survive the gap between completion and absorption.
The pattern in those cycles is consistent enough to be named. First, the technology being built was real, transformative, and eventually generative of large economic value over a multi-decade horizon. Second, the capital required to build it was raised against expectations of monopoly or near-monopoly returns to early-mover incumbents. Third, the build-out phase was substantially shorter than the absorption phase, with the consequence that the capital ran ahead of the revenue and the financiers, not the technology, took the loss. The AI cycle satisfies each of those conditions exactly. Three for three.
The magnitude of the spend was not the bull case's blind spot — the bull case named the magnitude before the spend arrived. Aschenbrenner's June 2024 Situational Awareness is the most credentialled insider statement of the bull case in print: trillions of dollars into GPU, datacenter, and power buildout before the end of the decade; total AI investment north of $1T annually by 2027; "AGI by 2027 is strikingly plausible" as the document's organising claim.29 His Table 5 had 2026 capex at ~$500B; hyperscaler capex has reached that with a year on the clock. Situational Awareness LP — founding backers Patrick and John Collison, Daniel Gross, Nat Friedman — has reportedly scaled from ~$250M to over $5.5B in twenty-two months. The bull case has serious, capital-backed authorship. The question this essay asks is not whether the spend is happening — it is, and the insiders saw it coming — but whether the spend can be paid back inside the cycle the markets are pricing.
Galloway put the cyclical version more sharply in May 2026: "the majority of GDP growth over the last two years has come from AI capex. If that slows down, we're immediately in recession."30 That statement does two pieces of work. It tells you the AI capex flywheel is now load-bearing for the macroeconomic expansion. It also tells you that, because the flywheel is load-bearing, the slowdown — when it comes — will not arrive in isolation; it arrives as a recession. The cyclical and structural cases stack.
V. The Revenue Gap — Cahn Arithmetic
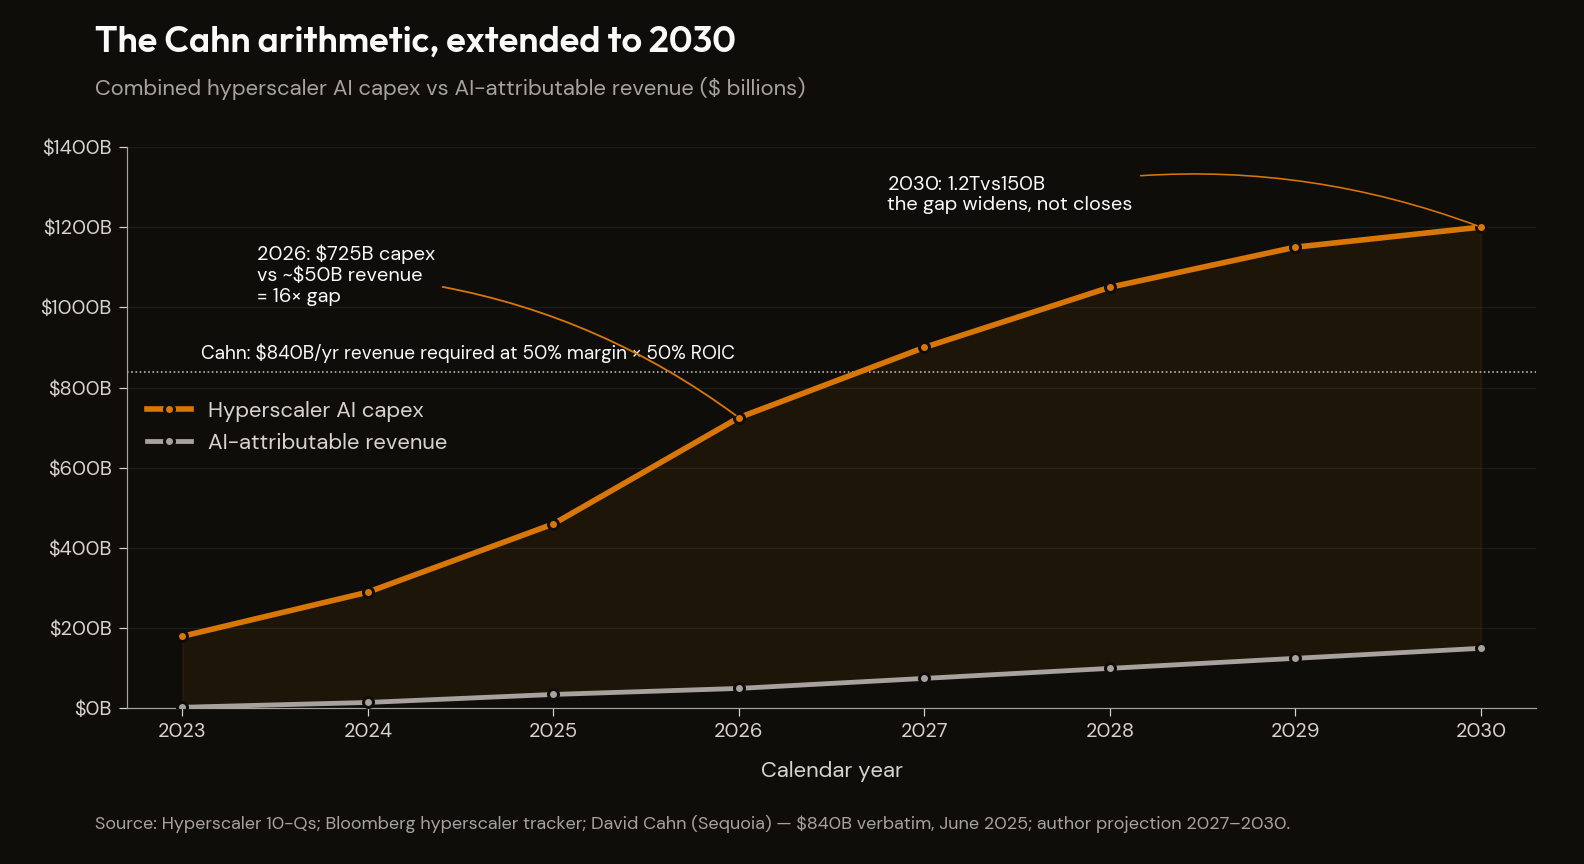
The cleanest single statement of the revenue gap is Cahn's AI's $600B Question note (September 2024) and its mid-2025 update.31 At a 50% gross margin and a 50% return-on-invested-capital hurdle — both reasonable for an industry expecting to compound — the AI infrastructure capex Cahn observed in 2024 implied an annual AI revenue requirement of approximately $600 billion. Observed AI revenue, excluding the chip sales that are the spend, was at most $10 billion. By mid-2025 the capex had accelerated and the implied revenue requirement rose with it. Cahn's revised number, verbatim: $840 billion per year. Observed AI revenue across OpenAI, Anthropic, Google's AI products, Microsoft Copilot, and AWS Bedrock combined was, on the most generous available accounting, under $50 billion.
The arithmetic gap, stated as one sentence: the AI infrastructure being built in 2025 to 2026 requires roughly $840 billion per year of revenue to justify itself, against current run-rate revenue of less than $50 billion. The gap is approximately sixteen times.
This is the equivalent, for this essay, of The Math Doesn't Work's observation that the United States is running its largest sustained primary deficit at full employment in peacetime history. It is the single arithmetic statement that, once made, the rest of the argument has to either accommodate or refute.
The directional shape of AI revenue has held against Aschenbrenner's projection: Microsoft AI at ~$37 billion annualised, Anthropic $30–40 billion, OpenAI $25 billion. But the spending he did not project has scaled faster than the revenue he did. Anthropic's reported $900 billion potential round — circulating in private markets through Q1 2026 — is the dot-com analog watch-point: at that valuation, the company is being priced on an arithmetic that requires AI revenue to compound at a rate no published research has identified as plausible, and that requires it to compound through a commoditisation curve the next section will document.
A bull would respond that AI revenue is in the early innings of an exponential and a sixteen-fold expansion over three years is plausible. Set aside whether that growth rate has ever been observed at the scale being demanded. The growth, if it arrives, depends on three independent conditions: enterprise AI deployment scaling at unprecedented rates, pricing power being maintained against open-source and Chinese competition, and the macroeconomic environment supporting enterprise software budgets through whatever cyclical adjustment the consumer side delivers. Each is independently uncertain. The conjunction is materially less likely than the consensus implies.
There is also a transmission problem the bull case rarely engages. The free cash flow that funds the next round of hyperscaler capex is generated, on a look-through basis, by consumer-facing revenue — the same revenue base §I documented. A consumer slowdown compresses Mag 7 free cash flow, which compresses the funding base for capex, which cascades to Nvidia revenue, which cascades to multiple compression for the entire AI-correlated portion of the index. The capex story does not stand independently of the consumer story. It is downstream of it.
VI. The Productivity Ceiling
The bull case for AI capex does not really live in the revenue arithmetic. It lives in the productivity arithmetic. The argument, in its cleanest form: if AI raises US labour productivity by some non-trivial amount, the resulting expansion of GDP and corporate earnings is so large that the capex pays for itself many times over, regardless of the year-by-year revenue mismatch.
The canonical research-house bull case is Goldman's March 2023 Hatzius-Briggs report: generative AI could raise US labour productivity by roughly 1.5 percentage points per year for ten years, producing a cumulative GDP gain on the order of 7% over a decade.32 The paper's own caveat, in the body, was that the estimate "depends critically on adoption rates and capital deepening." Those two assumptions are doing all the work.
The academic literature produces a sharply lower number. Acemoglu's task-based framework brackets AI's contribution to US TFP at no more than 0.66% over ten years — translated to GDP, a cumulative gain of approximately 0.93% to 1.16% over the decade.33 The mechanism is straightforward: AI is cost-effective for only a small share of cognitive tasks at current capability and inference prices; expansion to broader task substitution is bounded by deployment friction, training-data constraints, and the cost of reliability at production scale.
Two numbers, one decade, the same technology: between roughly 1% and 7% of cumulative GDP. The range is too wide to be informative as a forecast. What it is informative about is the trade-off the Mag 7 valuation requires. The valuation cannot be reconciled with both numbers simultaneously. It needs Goldman's productivity figure to justify the capex — only a 7%-of-GDP productivity gain produces enough enterprise software demand and ad-monetisable economic activity to clear Cahn's revenue gap. But it also needs Acemoglu's substitution rate — only a slow displacement of cognitive labour preserves the consumer cohort whose spending generates the look-through revenue that funds the capex in the first place.
The structural difference from the railroad and electrical-utility analogues is that those productivity gains were captured domestically. AI capex flows internationally in a way that breaks the analogy on its key dimension. Goldman's Hatzius has now described the asymmetry directly: AI capex outflows fund imported semiconductors (Taiwan, South Korea), while the displacement of US cognitive workers compresses domestic consumption. The historical productivity gains were a closed loop — domestic capex, domestic productivity, domestic consumption — and the loss in the dot-com bust was bounded by the same loop running in reverse. The AI cycle has a leak: the productivity dividend, to the extent it exists, accrues to the global supply chain rather than to the domestic consumer base that funds the capex. The telecom-fibre comparison holds on the share-of-GDP threshold and the build-out-versus-absorption timeframe; the closed-loop assumption of the historical productivity rescue does not.
The Cisco-vs-fibre permabull rebuttal deserves direct engagement here. The headline contrast — Cisco peaked at ~10% capital intensity to revenue; the hyperscalers are running close to 50% — makes the hyperscalers look five times more exposed and the bear case follow mechanically. The permabull reply is that the comparison is mis-specified: Cisco was a single-product hardware vendor selling routers to telecom operators with no diversified revenue base, while the hyperscalers are five-product enterprises (search, cloud, advertising, devices, content) operating at scale across diversified end-markets and balancing AI capex against operating cash flow several multiples larger than Cisco's. On that read, the high capex intensity is a function of absolute scale rather than the riskiness of the bet, and the gap will close on a delayed five-to-seven-year schedule consistent with the cloud-computing analog rather than the telecom-fibre analog. The reply is the strongest version of "capex will earn its keep" the bull side has produced.
The manuscript's response is that the diversification cuts in the bear's direction once the consumer-revenue look-through in §I is applied. The hyperscalers' diversified revenue base derives 71% on look-through from US consumer activity; the displacement mechanism in §II compresses that base on the same horizon the capex is being underwritten against. Diversification across products does not help if the underlying customer cohort is being thinned in lockstep. Cisco's customers were B2B telecom operators with their own diversified revenue. The hyperscalers' capex is committed against a customer base that is, on look-through, a single bet on US consumer purchasing power that the AI displacement is partially severing.
Goldman's macroeconomics desk has quietly de-rated to the lower bracket. Hatzius's view as of Q1 2026 is that AI added "basically zero" to 2025 US GDP, rising potentially to 0.3 to 0.7 percentage points by 2027 if adoption continues.23 That trajectory is consistent with Acemoglu's bound rather than with Goldman Research's earlier 7%-over-decade scenario. The bullish house has, on the macro side, walked back to a number a quarter of what it published three years earlier.
The empirical literature, bracketed between the two model-based estimates, is consistent with the slow-deployment story. Brynjolfsson, Li, and Raymond's Quarterly Journal of Economics paper (2025) found customer-support workers using generative AI tools produced 14% more output, with novices specifically producing 34% more.34 This is the bull-case bound at the task level. The Anthropic Economic Index, in its March 2026 update, supplied the most useful single number for the aggregation problem: across the Computer and Math occupational category, the theoretical feasibility of AI task coverage is approximately 94%; the observed coverage, measured from actual Claude usage, is 33%.35 Capability is ahead of deployment, which is ahead of monetisation. The capex is being committed now against revenue that depends on a deployment lag closing on a schedule no one has visibility on — and the capex schedule does not permit the lag.
VII. The Commoditisation Counter and the Insider Bears
The third constraint is the one the bull case has had the least to say about, because it arrived most recently.
In January 2025, the Chinese AI lab DeepSeek released its R1 model. The training-cost figure DeepSeek published, with the methodological caveats appropriate to a self-reported number from a Chinese lab, was less than $6 million — against the $100 million-plus that frontier US models are estimated to cost.36 The hardware was Huawei Ascend chips, not Nvidia. Performance on standard benchmarks including HumanEval, MMLU, and GSM8K matched or exceeded GPT-4o and Claude 3.5. The model weights were released open-source.
The market response was fast and unambiguous. Nvidia fell 17% in a single trading day, vaporising approximately $500 billion of market capitalisation. US tech as a whole shed close to $1 trillion that session.37 The mechanism, in plain terms: equity markets had been pricing AI capex on the assumption of monopoly returns to the firms that could afford the largest training runs, and DeepSeek was the first widely-noticed datapoint that monopoly might not hold. The 17% selloff partially reversed in the weeks that followed. The structural signal did not.
Aschenbrenner's framework had named the parity risk exactly backwards. Situational Awareness devoted thirty pages to algorithmic-secrets exfiltration and weight theft as the channel through which Chinese frontier capability would catch up — "failing to protect algorithmic secrets is probably the most likely way in which China is able to stay competitive in the AGI race."29 DeepSeek demonstrated that the lead could collapse without any weights leaving Anthropic's or OpenAI's machines. Algorithmic innovation and inference-time distillation, neither of which Aschenbrenner's framework engaged, produced near-frontier capability at roughly two percent of declared US training cost. The platform-layer monopoly assumption — the load-bearing premise of every bull case for the AI capex cycle, including Aschenbrenner's — was the first part of the framework to break.
By November 2025, Chinese AI models accounted for approximately 15% of global use share, against less than 1% twelve months earlier. The methodology of the TrendForce number that produced that figure is opaque enough that it should be treated as directional rather than precise — but the direction is the point.38 Open-source enterprise AI deployment, measured by HuggingFace and TrendForce together, rose from 23% to 67% of new deployments over the same year. The Mag 7 / OpenAI / Anthropic price stack is being routed around at scale. Llama, Mistral, DeepSeek, and Qwen are all available at near-zero marginal cost to enterprise customers who do not require frontier capability and increasingly do not.
Galloway is the primary voice for what the commoditisation does, because he names the dumping image directly:30
"I think China is beginning to engage in what I'll call AI dumping... I would just dump cheap AI into the US market."
The framing applies with equal force to two markets at once. Knowledge work is being supplied at near-zero marginal cost, with human wages compressing to whatever clearing level still attracts enough workers to fill the residual roles — the labour-side dumping documented in §II. The same image applies to the API price level. Frontier model labs raised prices in 2026 not because demand was strong but because the unit economics of inference at scale do not work without higher prices. Higher prices, in turn, push more enterprise customers toward open-source. The flywheel runs in the wrong direction.
There is a counter-counter that the bulls have begun to use, which is that DeepSeek's $6 million number excludes prior-generation training expenses and Chinese state subsidies for chip production, and that the true cost of producing a frontier-equivalent open-source model is materially higher. This is probably true. It is also irrelevant to the pricing-power question, because what matters for pricing power is not the cost of producing the model but the price at which a substitute is available to the enterprise buyer. The substitute is available at near-zero marginal cost. The buyer makes the substitution. The platform layer's monopoly rents do not arrive. Cahn's $840 billion revenue requirement assumes pricing power. The pricing power assumption is what is being eroded.
Stephanie Pomboy has emphasised the K-shape corollary that runs through the commoditisation argument with unusual precision. The same productivity gain that is supposed to let the Mag 7 crush smaller competitors is being commoditised globally faster than the Mag 7 can monetise it. The gain accrues to end-customers; the gain does not accrue to the platform layer at the rate the platform layer's capex schedule requires. The consulting-flip image from §II — junior analysts to AI engineers running 4-to-1 in 2015 and inverted by 2025 — has its corporate-revenue analogue here.15
The voices that have been most explicit about this configuration are not, in the main, outside critics. They are the investors, regulators, and policy leads inside the AI complex itself. By February 2026, the S&P 500 Software Industry Index had fallen roughly 20% over the prior year — Ezra Klein flagged the move at the top of his February 2026 conversation with Jack Clark, Anthropic's policy lead. Clark himself, in that conversation, expected an inflection in the broader employment data in 2026 to 2027 as AI displacement worked through the labour market.39 His commercial interest is for AI to be more impactful, not less; an Anthropic policy lead arguing displacement is real and accelerating cannot be dismissed as competitor sniping. Anton Korinek, presenting at the San Francisco Federal Reserve in April 2025, made the labour-market version of the same point: white-collar workers are now being displaced ahead of and faster than blue-collar workers, inverting the post-war pattern in which technology displaced manual labour and pushed cognitive labour up the value chain. Bill Gurley of Benchmark has been the most direct voice on the regulatory-capture version of this configuration. His 2023 All-In Summit talk argued that the AI moat being constructed was political rather than technological — national-security framing and incumbent lobbying producing rule-sets designed to lock in the labs that had already raised the largest rounds, not innovation policy.40
Gurley's framing is the most damaging to the bull case because it works with the bull case rather than against it. Concede everything: the Mag 7 do build moats, they do retain pricing power, the commoditisation argument does not bite as hard as the section's earlier paragraphs imply. Gurley's point is that the moat being built is regulatory rather than technological, that the rents being collected are political rather than productivity-generated, and that political rents are the most brittle form of competitive defence in a democracy where the political coalition can change. The bear case under Gurley's framing is not that the Mag 7's moat fails. It is that the moat succeeds, the productivity story it was supposed to underwrite never arrives, and the public eventually notices.
Aschenbrenner's framework continues to anchor the strongest version of the bull case: the scenario in which the productivity gain is large enough to overwhelm the commoditisation curve and the consumer-base concern alike. The framework requires the labour transition to be net positive over a longer horizon and does not deny that near-term displacement is severe. The bull case at its most articulate does not contest the direction of the consumer-side mechanism. It contests the timeline. The strongest version of that bull case deserves direct engagement in the body, because its analytical force depends on being met where the bear case is made. The general-purpose-technology base rate: every prior GPT — railroads in the 1860s, electrification in the 1920s, fibre in the late 1990s, cloud computing in the 2010s — produced a capex/revenue gap that closed on a five-to-seven-year delay as the technology found its productive use cases. The 1873 railroad panic gave way to the 1880s productivity boom; the 1929 utility crash to the electrification of the 1930s and 1940s; the 2000–2002 fibre wipeout to the cloud-and-mobile boom of 2007–2020. The financiers lost in each case; the technology productivity arrived; the equity holders of the survivors compounded extraordinarily. The bull case for AI, written most articulately by Mahaney, Gerstner and a handful of others, is that the cycle is the same — capex is over-shooting on the calendar, productivity arrives on the 2030–2032 horizon, the position to hold is the survivors.
The manuscript's reply is in three parts. First, the historical productivity gains in the GPT analogs accrued domestically — domestic capex funded domestic productivity that lifted domestic consumption, and the closed loop bounded the loss. AI capex flows internationally: the productivity, to the extent it arrives, accrues to Taiwan, Korea, and the broader Asian supply chain rather than to the US consumer base funding the spend. The loop is open. Second, displacement is arriving on a faster timeline than the absorption mechanism. The 1929–1940 electrification cycle absorbed displaced workers into the new electrified industries on a roughly decadal horizon; the 2026 cycle is displacing entry-level workers into a household-balance-sheet floor with weeks rather than years to adjust. Third, the financing chain is structurally different — hyperscaler capex is increasingly debt-funded into the private-credit complex that sits inside life-insurance balance sheets. The fibre losses in 2000–2002 routed through equity holders and bondholders of telecom companies; the AI losses route through annuity payments to retirees. If revenue compounds at GP-tech historical rates, the manuscript is wrong on this axis. The base case is that revenue compounding does not arrive on a schedule that closes the gap before the financing chain re-prices into a structure landing the loss on a different bearer than the historical analog.
The bull case has been engaged at full length in Appendix A — the four counter-arguments (DeepSeek as one-off, Acemoglu wrong, knowledge work moves up the ladder, plus the GP-tech base rate engaged above) get full prose engagement there. Compressed here: none is fatuous; none is fatal; each concedes ground in places that deepen the bear case rather than relieving it. Capex over-shoot is real and the financiers are the ones who lose. Falling inference costs are real and they make the platform unit economics worse, not better, because revenue per inference compresses faster than cost per inference at the platform layer. New jobs will be created and the transition that creates them is the source of the consumer impairment — the displacement is the bull case's mechanism for its own labour-side problem, not a separate criticism the bull case can dismiss. The combination — Clark's insider bear on labour, Korinek's empirical bear on white-collar displacement, Hatzius's quiet de-rate on macro productivity, Gurley's regulatory-capture frame on the moat, Pomboy's K-shape framing on consumption — does not constitute a single forecast. It constitutes a chorus of voices, each from a different vantage point inside the system, each saying the version of the AI story being sold to public-equity investors has problems specific to their domain. The consensus that the AI capex is unambiguously productive has fewer defenders than it did twelve months ago.
VIII. The Pick-One Trap
Bring the threads together.
The Mag 7 and the broader hyperscaler complex are committing the $725B 2026 capex against US GDP of $30T. The historical base rate at this share of GDP, on three prior tech-led capex cycles, is capital destruction.
The Cahn revenue arithmetic — $840B required, under $50B observed — remains the same 16× gap.
To close the gap on productivity grounds, AI must deliver Goldman's high-end estimate: approximately 7% cumulative GDP gain over a decade. The academic literature, in Acemoglu's task-based modelling, brackets the plausible upper bound at 0.93% to 1.16%. Goldman's own macroeconomics desk has de-rated to "basically zero" for 2025, rising to 0.3 to 0.7 by 2027. The bullish house has conceded the productivity ceiling.
To close the gap on pricing-power grounds, the Mag 7 must monetise their AI capability at the platform layer faster than the global commoditisation curve erodes their pricing position. Open-source enterprise deployment rose from 23% to 67% in 2025. Chinese AI global use share rose from under 1% to approximately 15%. DeepSeek R1 trained at less than $6 million on Huawei chips. The pricing power required to recoup the capex is being eroded faster than the capex schedule can cycle through.
To close the gap on consumer-revenue grounds, the top quintile that drives roughly 57% of US personal consumption expenditure must keep spending at the rate that produces 71% consumer-driven Mag 7 revenue on look-through. That cohort is experiencing wage compression historically only seen in deep recessions — the Atlanta Fed switcher premium inverted for the third time in fifty years; 40% of white-collar switchers taking double-digit pay cuts; AI-exposed workers aged 22 to 25 down 13%. The cohort whose spending sustains the revenue base is the cohort the same technology is severing.
There is a further turn of the screw in the form of a fact John Hussman has pressed on for years. Corporate profit margins, which currently sit at all-time highs and which justify a substantial portion of Mag 7 earnings expectations, are an accounting identity. They mirror, on the other side of the ledger, the deficits run by the government and household sectors. When government and household deficits compress, corporate margins compress with them. The 21% forecast 2027 operating margin for the S&P 500 — the highest in history — is sustained by the largest sustained government deficit in peacetime US history and the lowest savings rate since the immediate pre-GFC era. Both are unsustainable. When they normalise, margins normalise.
So the Mag 7 is being asked to compound earnings at 8% to 12% per year for five years against four headwinds:
- Consumer spending growth depends on a top quintile experiencing wage compression historically only seen in deep recessions.
- Profit margins underpinning earnings forecasts are at unsustainable highs that mirror unsustainable government and household deficits.
- AI capex flowing through Mag 7 revenue requires consumer-driven advertising and retail revenue to underwrite the next round.
- The AI productivity gains being used to justify long-run earnings expansion are themselves the mechanism reducing the disposable income of the consumer base that drives Mag 7 revenue.
The pick-one trap closes the loop.
The Mag 7 cannot simultaneously be priced for AI hyper-growth and protected from labour-market disruption.
This is the load-bearing argument of the essay, and it is worth stating in plain language. AI hyper-growth requires Goldman-bullish productivity. Protection from labour-market disruption requires Acemoglu-modest substitution. Either AI is transformative enough to deliver the productivity, in which case the displacement is correspondingly sharper and routes back through the consumer base on the other side of the ledger — the same base §I and §II showed underwrites roughly 71% of Mag 7 revenue. Or it is not, in which case the capex underwrites a return that is not coming. There is no scenario in which both are convenient.
Galloway's transmission runs from AI capex slowdown to recession in one step: take away the GDP contribution of the capex itself and the macro is in contraction. The consumer transmission runs in the opposite direction: wage compression to ad revenue softening to hyperscaler revenue softening to capex contraction to Nvidia revenue collapse to multiple compression for the entire AI-correlated portion of the index. Both transmissions converge on the same outcome through different mechanisms. The financial bear case does not require both to fire. It requires either. Both, on current evidence, are firing.
This is the manuscript-level version of what Luke Gromen has called the Mother of All Crises — the AI capex / sovereign-debt forced choice. Funding the AI infrastructure build at China-competition scale requires capital that can only come from bond-market monetisation, which destroys Treasury reserve-currency credibility. There is no path that preserves both. The Math Doesn't Work sketched the supply-side version: the AI–private credit fusion drawing on the same constrained Treasury duration pool the federal deficit is also drawing on. This essay is the demand-side version: the capex requires returns that productivity cannot deliver inside the cycle the deficit is forcing. Two sides of the same forced choice.
The diversification the index advertises — Section I established — is no longer present. The capex story and the consumer story are not independent risks the index can diversify across. They are the same risk wearing two costumes. When one fires, it triggers the other. The mechanical bid described in §III amplifies the concentration on the way up; the same mechanical regime symmetrically unwinds the concentration on the way down.
The capex underwriting Mag 7 valuations cannot earn its way back inside the window the multiple requires. The capex flywheel is being funded against a revenue side that is not arriving, into a productivity gain that is bracketed below what the capex needs, against a commoditisation curve that is collapsing pricing power before scale is recouped — and the moat being built to protect the platform layer is, as Bill Gurley names it, regulatory rather than technological.
The math, the productivity, the pricing power. Three constraints. One outcome.
The Mag 7 isn't seven stocks. It is a single bet on a US consumer that the labour market — increasingly transformed by the very technology the Mag 7 is being valued on — cannot produce. Concentration, in this configuration, is not protection. It is fragility magnification. When the consumer impairment that is currently visible in subprime auto delinquencies, in the Atlanta Fed switcher premium, in the Revelio Labs cuts, in the New York Fed survey series lows, finally translates into the Mag 7's reported revenue figures, the index does not absorb the shock. The index is the shock.
The math is the math. The timing is the question. The transmission from this concentration to the credit system — the place where the multiple compression becomes a default cascade — is the subject of Cracks in the Foundation.
Pick one.
Footnotes
-
Motley Fool — Magnificent Seven S&P 500 Tracker (April 14 2026); Apollo Academy — S&P 500 Concentration Approaching 50%. ↩
-
Fortune — Torsten Slok (Apollo Chief Economist) on the S&P 500 / Mag 7 pricing problem (July 25 2025). ↩
-
Apple Inc. — Form 8-K Exhibit 99.1, Q1 FY2026 Earnings Press Release (SEC EDGAR). ↩
-
Meta Platforms, Inc. — Form 8-K Exhibit 99.1, Q1 2026 Earnings Press Release (SEC EDGAR). ↩
-
Tesla, Inc. — Form 10-Q for the quarter ended March 31 2026 (SEC EDGAR). ↩
-
Alphabet Inc. — Form 8-K Exhibit 99.1, Q1 2026 Earnings Press Release (SEC EDGAR). ↩
-
Amazon.com, Inc. — Form 8-K Exhibit 99.1, Q1 2026 Earnings Press Release (SEC EDGAR). ↩
-
Microsoft Corporation — Form 8-K Exhibit 99.1, Q3 FY2026 Earnings Press Release (SEC EDGAR). ↩
-
NVIDIA Corporation — Form 10-Q, Q1 FY2026 (SEC EDGAR); customer-concentration disclosure on revenue exceeding 10% per Item 1 notes. ↩
-
Fortune — Moody's Analytics top-10% spending share (Sep 2025). ↩
-
Stephanie Pomboy, MacroMavens commentary on K-shape recovery, 2024–2026 series; cited across appearances on Wealthion, Real Vision, and Hedgeye. ↩ ↩2
-
Revelio Labs — White-Collar Workers Are Getting the Blues. ↩
-
NY Fed Survey of Consumer Expectations — Labor Market Survey. ↩
-
Brynjolfsson, Chandar, Chen — Canaries in the Coal Mine (Stanford Digital Economy Lab, Aug 2025). ↩
-
Meta Platforms — Q1 2026 Earnings Call Transcript (April 29 2026). ↩
-
Hatzius via Tom's Hardware — "AI added basically zero to U.S. GDP in 2025". ↩ ↩2
-
Mike Green, "Passive Inelasticity and Mega-Cap Multipliers," conversation with Dave Nadig, July 2025. Multiplier framework summarised in Green's Simplify research; quantification consistent with Jiang/Vayanos/Zheng NBER WP 28253. ↩
-
Jiang, Vayanos & Zheng, "Passive Investing and the Rise of Mega-Firms," NBER Working Paper 28253. ↩
-
MUFG — Hyperscaler capex above $600B in 2026, financing the AI supercycle. ↩
-
Leopold Aschenbrenner, Situational Awareness: The Decade Ahead (June 2024), pp. 7, 41, 75, 76, 80–81, 96. "AGI by 2027 is strikingly plausible" (p. 7); "automate basically all cognitive jobs" (p. 41); "trillions of dollars … into GPU, datacenter, and power buildout" (p. 75); "north of $1T annually by 2027" (p. 76); "failing to protect algorithmic secrets" (p. 96). Situational Awareness LP — founding backers Patrick and John Collison, Daniel Gross, Nat Friedman — has reportedly grown from ~$250M AUM at launch to >$5.5B in twenty-two months. ↩ ↩2
-
Scott Galloway × Steven Bartlett, The Diary of a CEO, May 4 2026 — "AI Wasn't Built For You. The Rich Don't Need You Anymore!". ↩ ↩2
-
David Cahn, AI's $600B Question, Sequoia Capital, September 2024; David Cahn, Why AI Labs Are Starting to Look Like Sports Teams, Sequoia Capital, June 17, 2025 ($840B verbatim update). ↩
-
Goldman Sachs — Generative AI could raise global GDP by 7% (Hatzius and Briggs, March 2023). ↩
-
Daron Acemoglu — The Simple Macroeconomics of AI (NBER WP 32487, May 2024); formalised in Economic Policy 40(121), 13–58 (2025). Central estimate: ≤0.66% TFP gain over 10 years; 0.93–1.16% cumulative GDP. ↩
-
Brynjolfsson, Li, Raymond — Generative AI at Work, Quarterly Journal of Economics 140(2), 889–942 (2025). ↩
-
Anthropic Economic Index (February/March 2026 update). Theoretical task feasibility ~94% in Computer and Math occupations against observed Claude usage of ~33%. ↩
-
DeepSeek-AI — DeepSeek-R1: Incentivizing Reasoning Capability in LLMs via Reinforcement Learning (arXiv:2501.12948, January 2025). Self-reported training-cost methodology is contested; cite as DeepSeek's stated figure. ↩
-
TrendForce — Chinese AI model market share, November 2025 coverage. ↩
-
The Ezra Klein Show (New York Times) — How Fast Will A.I. Agents Rip Through the Economy?, February 24 2026; Ezra Klein interview with Jack Clark of Anthropic. Column page. ↩
-
Bill Gurley — All-In Summit 2023, 2,851 Miles (regulatory-capture talk on AI) — Fortune coverage, September 2023. ↩