The Cracks Already There
In 60 seconds
Five fragilities — private credit, commercial real estate, JGBs, the consumer, AI capex — are coupled through a single liquidity vector (Howell's GLI). Private-credit shadow defaults are ~6% vs headline 2.1%; CMBS office is 12.3%; Q1 2026 saw the first redemption squeeze. The Fed cannot fix all five simultaneously because Hunt's velocity-collapse argument breaks the easing channel. The 2020 intervention does not repeat in this configuration.
Democracies cannot fix their long-term problems before crisis. The political system that produced the diagnostic catalogue is not in a position to act on it. If the configuration this manuscript has documented across the diagnostic block cannot be reformed in the time available, then the next analytical question is not political. It is mechanical. How does a configuration like this resolve?
The orthodox answer — embedded in the risk frameworks of every major financial institution, the DSGE models of every major central bank, the valuation models on every analyst's terminal — is that it resolves gradually. Excess is corrected by market mechanisms. Prices fall to fair value. Capital is reallocated. The system reaches a new equilibrium through manageable corrections. This account assumes a particular type of system: one that reverts, that has a gravitational centre, that exhibits smooth response to stress.
The literature on complex systems describes a different type of system. Coupled. Phase-transition-prone. Stable until it is not. This essay is about that type of system, the signatures that distinguish it from the smooth-correction type, the framework that reads its precursors, and — once the framework is named — the empirical inventory of where the cracks actually sit in the configuration as it stands in May 2026.
Complex systems break through rising co-movement, accelerating fragility, and detectable precursor patterns. Bar-Yam's pre-2008 working papers validated the first;1 Taleb's second-derivative apparatus formalises the second;2 Sornette's log-periodic framework reads the third.3 Per Bak's self-organised criticality is the conceptual substrate underneath all three. None of these frameworks is a forecast. Each is a method.
I. The Type of System That Breaks
The intuitive answer to how does this resolve is gradual deterioration. It is wrong about the system type. Gradual deterioration describes a stable system experiencing stress within its elastic range. The configuration the diagnostic block has described is a system with coupled fragilities, in which individual hedges do not diversify the system-level risk because the diversification is cosmetic; in which the marginal price-setting mechanism is mechanical rather than informed; and in which the political backstop has been demonstrated, by the prior essay, to be structurally unavailable before crisis.
A configuration of that type transitions. It does not correct. The transition is not predictable at the day level, but the regime that precedes it is identifiable in advance. The orthodox frameworks that already failed — efficient-markets pricing in 2007, value-at-risk in 2008, DSGE on the entire post-2008 cycle — failed not because they got the data wrong, but because they assumed the wrong system type.
II. The Framework — Co-Movement, Fragility, Precursors
Phase transitions in complex systems are visible through co-movement before they are visible through prices. As the system approaches its critical state, previously independent components begin to share an underlying factor — usually a collateral structure, a funding dependence, or a common counterparty exposure — and that shared factor manifests in the data as rising correlation. The rising correlation is the structure changing shape. The framework triangulates this regime through three independent methods: Bar-Yam's co-movement diagnostic, Taleb's second-derivative apparatus, and Sornette's log-periodic precursor pattern.
The conceptual substrate is Per Bak's self-organised criticality (SOC), synthesised in How Nature Works (Copernicus, 1996). The canonical sandpile demonstration: grains added one at a time drive the pile to its critical angle of repose, where the next grain might trigger an avalanche of any size, with avalanche sizes distributed by a power law. SOC is the structural property of the system, not of any individual grain.
Bar-Yam's 2007 and 2008 NECSI working papers took the SOC apparatus from physics to financial markets.1 The argument: cross-equity co-movement had risen substantially and continuously across the four years preceding the September 2008 collapse — a structural signal that the equity market was becoming progressively more internally correlated, less genuinely diversified, more dependent on a single shared factor underneath the surface diversity of individual names. The pre-crash publication date is the falsifiability move; the 2008 collapse passed the out-of-sample test. The orthodox apparatus — VaR, DSGE, efficient-market pricing — did not detect the precursor because it assumes the correlation structure is stationary.
Taleb's second-derivative apparatus explains why coupled systems break the way they do.2 A fragile system has a harm function h(x) whose h″(x) < 0 over the relevant stress range: each additional increment of stress produces more additional harm than the previous one. Fragility is computable before the event — you do not need to estimate the probability of a perturbation to identify that a system is fragile. You need only examine the curvature of its response function. The "turkey problem": a turkey is fed daily for 999 days, the inductive evidence strengthening every day; on day 1,000, it is slaughtered. The first derivative was positive throughout; the second derivative was deeply negative.
Sixteen years without major phase transition is precisely the regime in which fragility is most reliably underestimated. The AI Reckoning documented an equity concentration in which seven names constitute 31% of the index4 and their valuations are priced for compound earnings growth at rates the post-WWII S&P has never sustained — a concave harm function in which small disappointments produce manageable compression while larger ones trigger index-level outflows. The Math Doesn't Work documented a sovereign-debt arithmetic in which net interest exceeded defence in FY2024,5 breaching Ferguson's Law for the first time in nearly a century6 — a concave harm function in which small real-rate rises crowd out productive expenditure and require further issuance. Sections V–IX document the same curvature in private credit, CRE, JGBs,7 the consumer, and AI capex.
Sornette's log-periodic power-law (LPPL) framework — Why Stock Markets Crash (2003); the ETH Zurich Financial Crisis Observatory maintains a public prospective record — is the tertiary anchor.3 LPPL argues that speculative bubbles produce a characteristic mathematical signature: an accelerating, oscillating price path whose oscillation frequency increases as the critical time approaches. LPPL identifies a regime; it does not pin a date. The load-bearing distinction is between "dragon-king" events and Black Swans. Black Swans are extreme outcomes in the tail of a distribution; dragon-kings lie outside the distribution, generated by a different mechanism that activates only when a threshold is crossed. 2008 was a dragon-king — a qualitatively different event produced by a coupled-fragility cascade. If the system is in a dragon-king regime, standard risk management is fitted to the wrong distribution.
The convergence is the load-bearing claim. Three methodologies, developed independently across roughly two decades, converge on the same diagnosis when applied to the configuration the diagnostic block has documented. No single method's precision is what the argument rests on. The convergence is the regime diagnosis.
III. The Seven-Case Structural Pattern
The framework becomes empirically grounded when the historical cases are examined with it. The pattern across 1929, 1987, 1997–98, 2008, March 2020, the September 2022 UK LDI crisis, and the March 2023 SVB sequence is not that the same proximate cause repeats. It is that the structural signature repeats across radically different proximate causes. The cases share architecture even where they share nothing else.
1929. The pre-transition signature was leverage concentration in call money, high internal correlation under a single new-era narrative, and rising small bank failures (the sandpile's small avalanches). The Hatry Group's September 1929 collapse in London — a small event — is often cited as the first domino; the cascade was not proportionate to its scale.
1987. Portfolio insurance — dynamically hedging equity exposure by selling futures as prices fell — had become sufficiently widespread that the strategy itself created a mechanical feedback loop: falling prices triggered futures sales, futures sales drove prices lower, lower prices triggered more sales. The Black Monday 22.6% one-day decline was a dragon-king event produced by a coupling structure each participant's individual contribution to which was individually rational.
1997–98. The "Asian miracle" currencies had been assumed independently strong. The actual correlation across them was a common dependence on short-term dollar borrowing to fund long-duration local-currency assets. When Thailand broke the dollar peg in July 1997, the shared dependence was revealed; the correlation structure jumped from apparent independence to near-unity in weeks. LTCM in 1998 is the arbitrageur's version: positions assumed independent shared a common factor — risk appetite — that became dominant when the regime changed.
2008. The Brunnermeier (2009) account in the Journal of Economic Perspectives is the canonical academic treatment.8 CDO-squared structures, AAA-rated tranches assumed independent of underlying mortgage performance, and repo-market funding chains were each coupling mechanisms. The co-movement signal Bar-Yam's NECSI work documented was the aggregate signature of these mechanisms operating at scale.1 Bear Stearns was rescued March 16, 2008; Lehman filed September 15. The precursor co-movement signal had been visible across roughly four years. The signal is long; the cascade is fast.
The 2008 cross-asset behaviour is the canonical empirical demonstration of the coupling phenomenon. Historically uncorrelated assets — equities, investment-grade credit, commodities, cross-country equities — moved sharply toward unity in September and October 2008. The diversification benefit investors had modelled and priced did not survive the regime change. Brunnermeier (2009)8 and Adrian–Brunnermeier (2016, "CoVaR")9 document the rise.
March 2020. The Treasury market briefly stopped functioning. Bid-ask spreads on US Treasuries reached levels not seen since 2008. The mechanism was forced selling: risk-parity funds, mortgage REITs, and hedge funds held Treasuries as the "safe" asset; when volatility spiked across all risk assets simultaneously, they sold Treasuries to meet margin calls. The "safe" asset sold alongside the risky assets. The Fed's intervention — unlimited Treasury purchases, roughly $4 trillion in balance-sheet expansion — arrested the transition. The strongest counter-argument case for orthodoxy: 2020 worked. Engaged below.
September 2022 — the UK LDI crisis. UK pension funds had adopted liability-driven investment strategies, using interest-rate swaps to match liability duration, funded through short-duration repo borrowing against long-duration gilt collateral. When the Truss "Growth Plan" — forty-five billion pounds of unfunded tax cuts announced without an OBR forecast — triggered a rapid gilt sell-off, collateral values fell, pension funds received margin calls, they sold gilts, prices fell further. The Bank of England intervened as emergency buyer of last resort within two weeks. The cascade was sharp because the coupling was concentrated in a single asset class and investor type.
March 2023 — Silicon Valley Bank. SVB's balance sheet had the second-derivative fragility Taleb's framework identifies: a long-duration bond portfolio marked to cost, funded by short-duration deposits from a networked, information-rich base. When the mark-to-market loss became public, the coupling was the shared information network of SVB's depositors. Roughly $42 billion in deposits withdrew in a single day; the cascade from SVB to Signature to First Republic took three weeks. The Fed's Bank Term Funding Programme arrested the cascade by absorbing the duration-mismatch risk onto the sovereign balance sheet.
The pattern across all seven cases is consistent. First, a period of apparent stability during which a coupling mechanism is building. Second, a rising co-movement signal readable in the data but not in the orthodox risk framework. Third, a relatively small first trigger — not the largest fragility, not the most-anticipated risk. Fourth, a rapid cascade driven by the coupling mechanism, not the direct economics of the trigger. Fifth, a period of high-velocity resolution fundamentally different in kind from a normal market decline.
The seven cases differ in proximate causes, geographies, and instruments. They do not differ in the structural signature. The signature is the framework's empirical content; the proximate causes are noise.
IV. The Connection Thesis — Howell as the Meta-Clock
Complex systems do not break through the failure of a single component. They break through the sudden co-movement of previously independent parts. When previously diversified things start moving together, the diversity is being revealed as cosmetic. There is one shared dependence underneath.
The shared dependence in 2026 is dollar liquidity. Each crack below is independently legible. Each is also funded, sustained, or indirectly priced by the availability of global dollar liquidity — Alden's dollar-recycling-machine framing.10 When dollar liquidity contracts, every asset class faces simultaneous pressure — not because they are linked by earnings, demographics, or geography, but because they are mechanically linked by collateral.
Howell's Capital Wars (2020), refined across his Substack since,11 supplies the timing dimension. His reframing of how financial systems work is worth stating directly.
"Financial markets today are dominated by the need to roll over existing debts, not fund new productive investments."
— Michael Howell, Capital Wars Substack, "Global Liquidity"12
The reframing changes what fragility means. The question for a debt-refinancing system is not whether companies can earn their way through the cycle on fundamentals. The question is whether the global refinancing machine can absorb the maturing stock of debt as the liquidity tide turns. Howell's research establishes that approximately 80% of lending in the global system is collateral-backed, which means the refinancing question is also a collateral question. When asset valuations decline, collateral values decline, lenders demand additional capital, and the system contracts.
"Something like 80% of all lending in the world economy now requires some form of collateral. […] you get a pro cyclical and highly risky financial system that becomes in great need of bailout by policy makers and central banks."
— Michael Howell, MacroVoices podcast, "Are We Approaching A Debt Refinancing Crisis?" (the bracketed elision marks roughly seven intervening sentences in the original transcript)
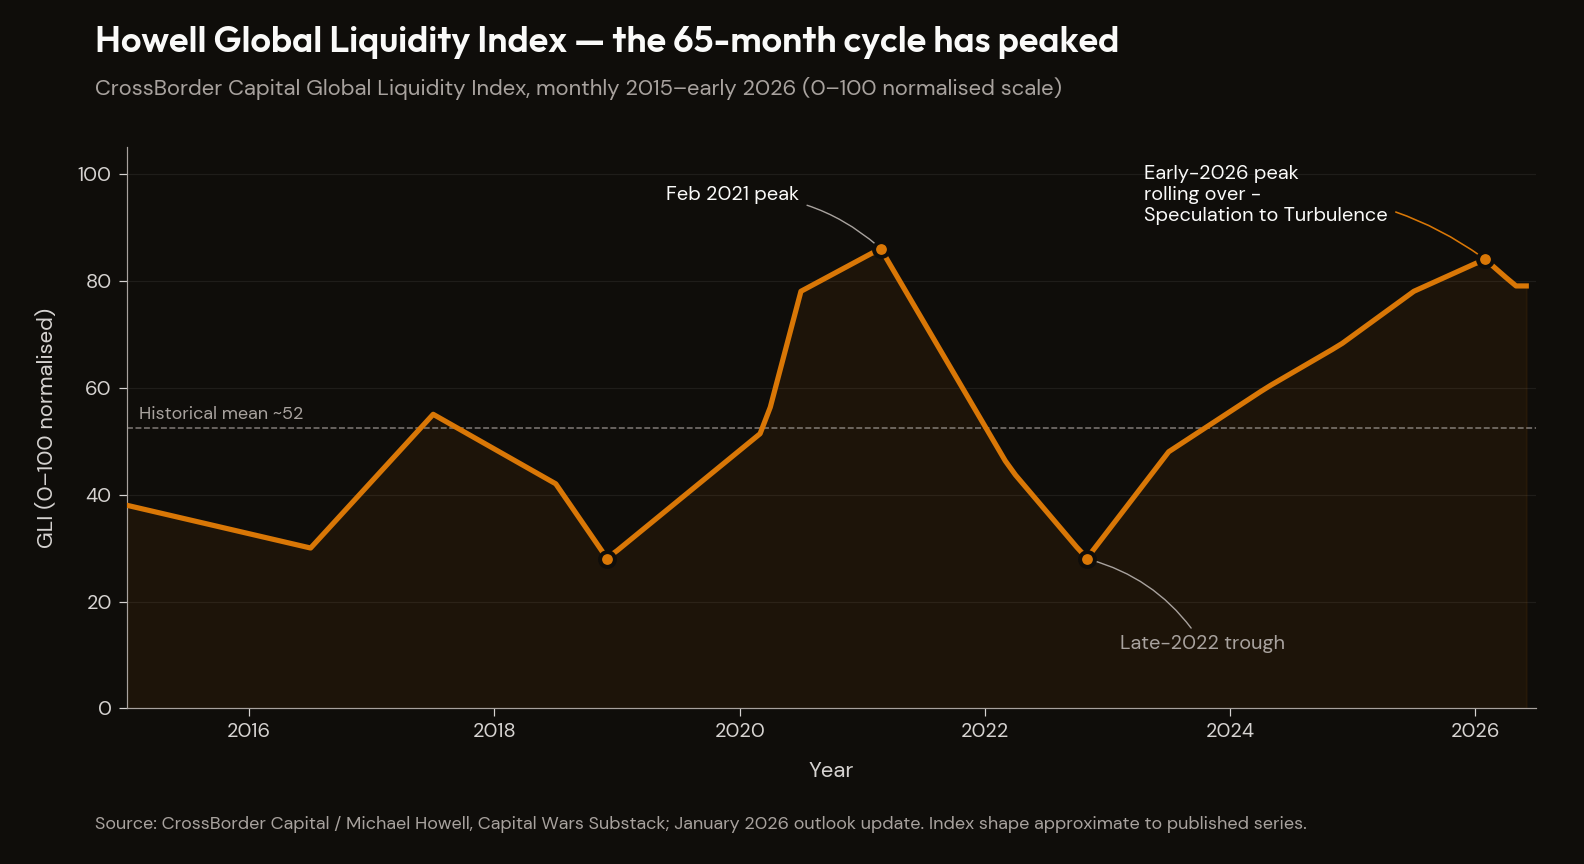
The 65-month global liquidity cycle Howell has identified — its duration approximately matching the average maturity profile of global debt, which is the structural reason a cycle of that length exists at all — moves through four stages: Rebound, Calm, Speculation, Turbulence. The cycle bottomed in late 2022 and, per Howell's January 2026 update,13 peaked in early 2026. The next transition — from Speculation into Turbulence — is where refinancing stress becomes empirically visible.
The mechanism by which the cycle's transition from Speculation to Turbulence becomes concrete is the maturity wall facing the system in 2026–2028. The dominant cohort of debt now coming due was issued at zero-rate-era yields between 2009 and 2011 — government, corporate, and household debt issued at 0.5% to 2% that now refinances at 4% to 5%.
Howell's framing of the load — as synthesised in aggregator coverage of his 2026 outlook — is that global liquidity will peak by early 2026, with the subsequent Speculation-to-Turbulence transition driven by approximately $40 trillion of debt refinancing across government, corporate, and household sectors arriving in the 2026–2028 window.14
Howell uses the $40 trillion figure in primary writing as the aggregate rolling-stock load by 2027 across all sectors; aggregator coverage has reorganised this into the government/corporate/household triad above. The load is mechanical either way. The maturation schedule of 2009–2011 issuance is fixed. It does not depend on whether a recession arrives, whether the Fed cuts, or whether AI productivity surprises to the upside. It arrives on the calendar it was issued on.
The US Treasury market sits at the centre of this. It is the world's largest source of dollar-denominated collateral. As the Fed runs off its balance sheet and Treasury issuance accelerates to finance the documented deficits, the question is who absorbs the incremental supply. Howell's empirical conclusion is that no reliable marginal buyer exists for incremental Treasury supply at yields consistent with current asset valuations. Foreign central banks are net sellers; domestic households are not net buyers at current real yields. The mechanical bid that does exist — passive equity flows, GENIUS Act stablecoin reserves backed in Treasuries — is the manuscript's fourth motif made structural. The marginal price-setter is no longer the informed value investor; it is the algorithm, the regulatory mandate, or the actuarial requirement. The mechanical bid that has held the system up on the way in mechanically reverses on the way out.
There is an honest performance question. Howell has been calling a liquidity peak and a contraction-driven turbulence transition for several years; asset-price dislocations have, on multiple occasions in 2024 and 2025, not arrived on the dates his publications implied. The CrossBorder Capital GLI shows directional accuracy on liquidity flow but timing imprecision on asset-price translation. The essay relies on the framework's mechanism — the $40 trillion calendar, the collateral-cascade procyclicality — rather than on a narrowly correct date.
Howell is the meta-clock. The four sub-readings that follow — private credit, CRE, JGBs, consumer, AI capex — are not independent clocks. They are coupled to Howell's liquidity vector; when the vector reverses, the connections become transmission channels. The convergence of "five clocks" is one master clock and four sub-readings hanging off it. The argument is not that all five cracks will break simultaneously by coincidence; it is that they cannot be evaluated independently, because a stress event in one transmits to the others through shared collateral, shared lenders, shared funding structures, and a shared dependence on a global liquidity cycle that has now peaked.
The five fragilities, compressed against the same dashboard so the sub-readings can be read together rather than as five separate stories:
| Fragility | Current reading | Mechanism | Transmission | Watch trigger |
|---|---|---|---|---|
| Private credit (direct lending) | Shadow default rate ~6% (PIK-by-amendment included); headline 2.1% | Amend-and-extend suppresses headline; PIK suggests cash-flow distress | Insurance balance-sheet impairment; annuity-holder consequences | Second redemption squeeze; large BDC fund gates |
| Commercial real estate (office) | Office CMBS delinquency 12.34% (record); $25B past maturity without resolution | Floating-rate refinancing into 4%+ coupons fails | Regional-bank failure on CRE concentration | NYCB or peer 2026 disclosure; CMBS workout |
| Japanese sovereign bonds | BOJ holds ~49% of JGBs outstanding; balance sheet ~99–101% of nominal GDP | YCC unwind exposes back-end yields; domestic absorption capacity question | Carry-trade unwind; basis-trade pressure; Treasury demand impact | BOJ YCC band moves; JGB 10y above 1.5% |
| Consumer | Subprime auto 32-yr delinquency record; revolving APR >21%; 4 in 10 cannot cover $400 | Bottom decile is mineshaft; K-shape compresses median-household spending power | Consumer credit cycle; retail demand for Mag 7 consumer revenue | Serious delinquency in revolving credit; subprime auto cascade |
| AI capex | $725B 2026 guidance; revenue/spend gap ~16×; CoreWeave/Blackstone GPU-collateralised debt | Hyperscaler FCF turn; private-credit AI exposure repricing | Mag 7 drawdown propagates; private-credit insurance chain | Anthropic round; hyperscaler Q2 earnings; CoreWeave debt pricing |
The four-lever forced choice
Howell's meta-clock establishes that the global liquidity cycle is rolling over. Hunt's velocity-collapse argument (developed at greater length in §X) establishes that the conventional easing channel the Fed used in 2008 and 2020 does not repeat in this configuration. Together those two deliver a fragility argument. The manuscript's central claim — that the cuts are not chosen but are what is left when the alternative policy responses fail — requires a third piece: the forced-choice argument. Dalio's framework in Principles for Dealing with the Changing World Order (2021)15 maps the policy-response space onto the configuration.
The four levers a sovereign confronts when public-sector debt compounds against shrinking demographic productivity are:
- Austerity — cut spending and/or raise taxes such that the budget balances or surplus arises.
- Default — renegotiate or write down nominal obligations.
- Monetisation — have the central bank absorb issuance, accepting the inflation that follows.
- Wealth transfer — redistribute through tax or asset levies, shifting the cost across the income distribution rather than across the time-horizon.
Each lever has a political cost that constrains its use as a pre-emptive policy choice in a fragmented democracy. Austerity at the scale required to close the current US structural deficit — roughly two trillion dollars per year — is politically inviable inside the demand-side trap The Democratic Trap describes. Default in the form Reinhart-Rogoff would code it is institutionally inviable for the issuer of the global reserve unit. Monetisation in its explicit form invites the post-2020 inflation episode at scale and was, in 2022–23, exactly what the Fed's credibility-recovery posture was designed to refuse. Wealth transfer at the scale required collides with the political-economy constraint that the constituency benefiting from low sovereign rates is the same constituency a wealth-transfer programme would tax.
All four levers are politically blocked as pre-emptive choices, so what happens instead is the implicit version of each: passive monetisation through Fed balance-sheet absorption with maturity extension, implicit default through inflation-mediated real-asset depreciation, implicit wealth transfer through statutory cut on the entitlement beneficiary class, and implicit austerity through the discretionary spending compression The Math Doesn't Work documented. The system does not choose one of the four. It defaults to a combination of all four in their implicit forms, distributed across constituencies that lack the political coordination to refuse.
This is the forced-choice argument the manuscript's framing depends on. The default is the cut — The Math Doesn't Work's spine — is the conclusion of the Dalio four-lever framework applied to a configuration where each lever is politically constrained as a pre-emptive choice. Hunt's velocity collapse explains why the conventional easing channel does not produce a fifth lever; Dalio's framework explains why the four levers that do exist collapse into an unchosen combination rather than a chosen policy.
The 2020 Fed intervention worked because the velocity channel was open, the credibility cost of monetisation was politically affordable, and the household balance sheet had not yet thinned. None of those three conditions holds in 2026–27. The intervention does not repeat in the same form. The forced-choice that Dalio's framework names is what replaces it.
V. Private Credit — The Most Opaque Mechanical Leg
Private credit is the crack the mainstream financial press has been slowest to diagnose. The opacity is structural. Private credit funds publish quarterly NAV marks based on internal valuation models; the primary product they sell to limited partners is precisely a smoother return profile than public-market credit. The smoothing is the value proposition. The diagnostic question is what is being smoothed.
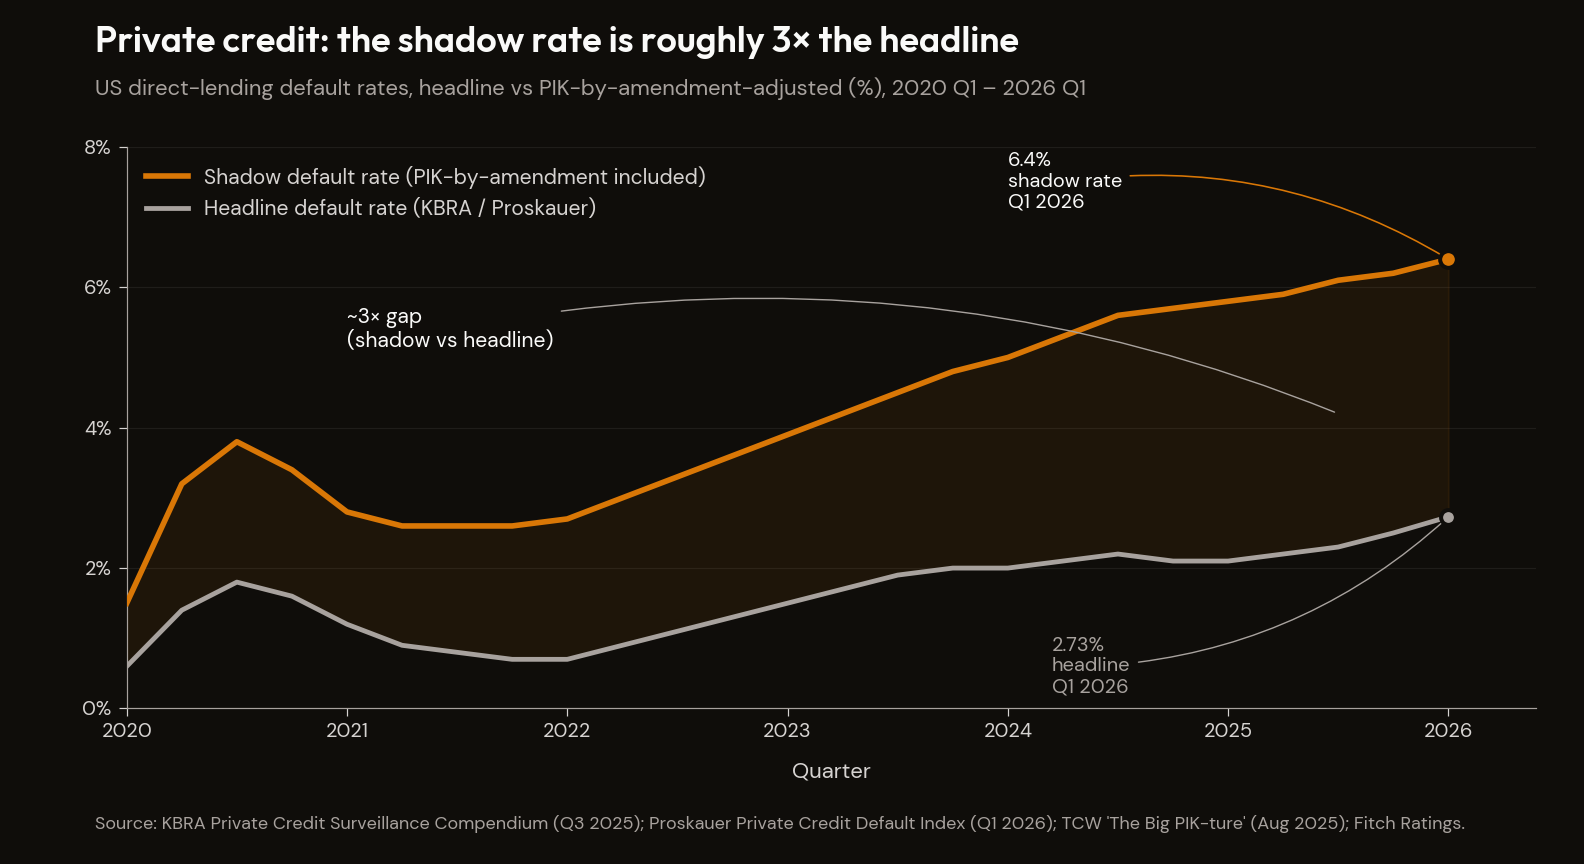
Fitch reported in February 2026 that US private credit trailing-twelve-month defaults reached 5.8% — the highest reading since the metric began tracking in August 2024.16 That number is already above the 2–3% headline rate the industry's largest sponsors have continued to cite. But the headline number itself understates the stress, because the private credit market's most consequential risk-management tool is not default. It is amendment.
Payment-in-kind interest by amendment — PIK-by-amendment — is the practice of rolling cash interest obligations into principal because the borrower cannot pay cash on the originally agreed schedule. The lender accepts worse terms in exchange for not triggering a default event. This is functionally a distressed exchange. PIK-by-amendment in US direct lending has risen from 2.6% in 2021 to 6.1% in Q3 2025, per Proskauer's data.17 KBRA's headline private-credit default rate sits at 2.1%.18 When PIK-by-amendment is treated as a functional default, the shadow default rate is approximately 6%, roughly three times the headline. S&P data show selective defaults outpacing conventional defaults five-to-one in 2024; roughly 65% of all 2025 corporate defaults were distressed restructurings rather than payment defaults. Amend-and-extend buys time off the headline default series at the cost of a building shadow obligation.
The Fitch 5.8% figure, KBRA's 2.1%, and the Proskauer-derived 6% shadow rate are constructed from different bases. The point is not that one number is right and one is wrong; it is that the gap between the headline and the shadow is itself the load-bearing fragility. When the gap is roughly three times the headline, the system has a substantial inventory of distressed obligations moved off the headline series and onto the maturity ladder.
Per the IMF's April 2026 Global Financial Stability Report, private credit globally is roughly $2 trillion in committed capital, of which approximately $300 billion sits in semi-liquid structures subject to retail redemption.19 The Fed's November 2025 Financial Stability Report documents that bank credit commitments to nonbank financial entities reached $2.5 trillion in the first half of 2025, of which approximately a quarter flows to private-credit providers.20 Private credit is connected to the banking system through these committed lines.
It is also connected to the insurance sector through a structural shift that is the most opaque mechanical leg of the entire system — and the leg that has received the least analytical attention. This is where the manuscript's fourth motif extends into private credit in the way the mechanical-bid analysis hinted at without fully tracing. Corporate pension plans have, over the past decade and at accelerating pace, been converting their accumulated obligations into group annuities administered by life insurance companies. The pension transfer is a balance-sheet move: the employer offloads the long-duration liability, the insurer assumes it, and the insurer must invest the assets backing the annuity book to match the duration and yield characteristics of the obligations. Insurance balance sheets, for that reason, have been allocating a steadily growing share of their portfolios to private credit — illiquid, higher-yielding, longer-dated.21 The insurance balance sheet is becoming the passive anchor of private credit in the same way 401(k) auto-enrolment became the passive anchor of US equities. The marginal buyer of a private-credit dollar is not, increasingly, an informed credit investor performing primary-source underwriting. It is an actuarial mandate matching a liability schedule, where the matching is determined by a regulator's published-rate yield curve and an internal asset-liability-management model. When the private-credit shadow default rate eventually resolves into reported losses, the transmission goes not just to BDC holders but to insurance policyholders and to the pension beneficiaries whose obligations the annuity books are now backing.
The 2025 default events are the visible tip of an amend-and-extend iceberg. First Brands filed Chapter 11 in September 2025; the bankruptcy revealed invoice-pledging to multiple lenders simultaneously without cross-checking of collateral.22 Tricolor Holdings filed Chapter 7 the same month; the wind-down revealed double-pledging of identical loan portfolios across separate lenders.23 Saks Global executed a July 2025 transaction S&P described as "tantamount to a default." None was a household name; each was, before the failure, a borrower whose marks were stable. The shadow rate is the quantification of how many more are in the queue.
The view from Cape Town adds a transmission channel the US/UK-vantage analyses tend to omit. The private-credit architecture has been a meaningful destination for EM corporate borrowers — South African, Brazilian, and Indonesian mid-cap issuers whose domestic banking systems cannot price or absorb the equity-style risk private credit funds will take, and who therefore borrow dollars from US-based direct lenders against rand-, real-, or rupiah-denominated cash flows. When the shadow default rate resolves into reported losses, the dollar-denominated cash payment obligation on the EM-issuer side does not flex; the rand or real cost of servicing that obligation flexes through whatever the FX cross is doing at the moment of stress. The private-credit shadow obligation, viewed from an EM-issuer balance sheet, is not a US credit problem; it is a currency-mismatched cash-payment problem on a calendar set by lenders whose own funding conditions are tightening simultaneously. The 1997–98 Asian crisis was the same architecture in different wrappers: dollar-denominated short-term funding against local-currency long-duration cash flows, fine until the dollar tide reversed. The EM-issuer leg of the private-credit fragility is the part that does not show up in the IMF GFSR's regional charts and is most visible to the people writing the cash-flow forecasts on the obligor side.
The honest counter is the Apollo / Blackstone selective-disclosure response: headline charge-off rates remain low by historical corporate-credit standards. The counter has force in the headline data and not in the structural one. The load-bearing fragility is the gap between headline and shadow, the PIK-by-amendment runway running out as Howell's refinancing cycle turns, and the insurance-mediation channel transmitting losses to balance sheets that did not, until recently, carry meaningful private-credit exposure.
VI. Commercial Real Estate — The Visible Refi Wall
Commercial real estate is the crack that has been most discussed in mainstream coverage and most consistently underestimated in severity. The maturity wall is not being managed. It is being queued.
The 2021–2022 origination boom — driven by the post-COVID liquidity surge and a brief moment when 10-year Treasury yields sat below 1.5% — created a large cohort of CRE debt issued at low rates against high valuations. That debt is now maturing across 2026–2028 against valuations 30–40% below origination basis in office and retail categories, and against refinancing rates substantially above the rates at which the original loans were written. A borrower who took a 2021 office acquisition loan at 65% LTV with property values down 35% now owns a property whose current value is below the loan balance. The lender extending is taking equity risk at the price of a loan; the lender foreclosing is recognising the loss immediately. Neither has an obviously dominant move — the configuration in which extensions stretch out until the maturity wall stops cooperating.
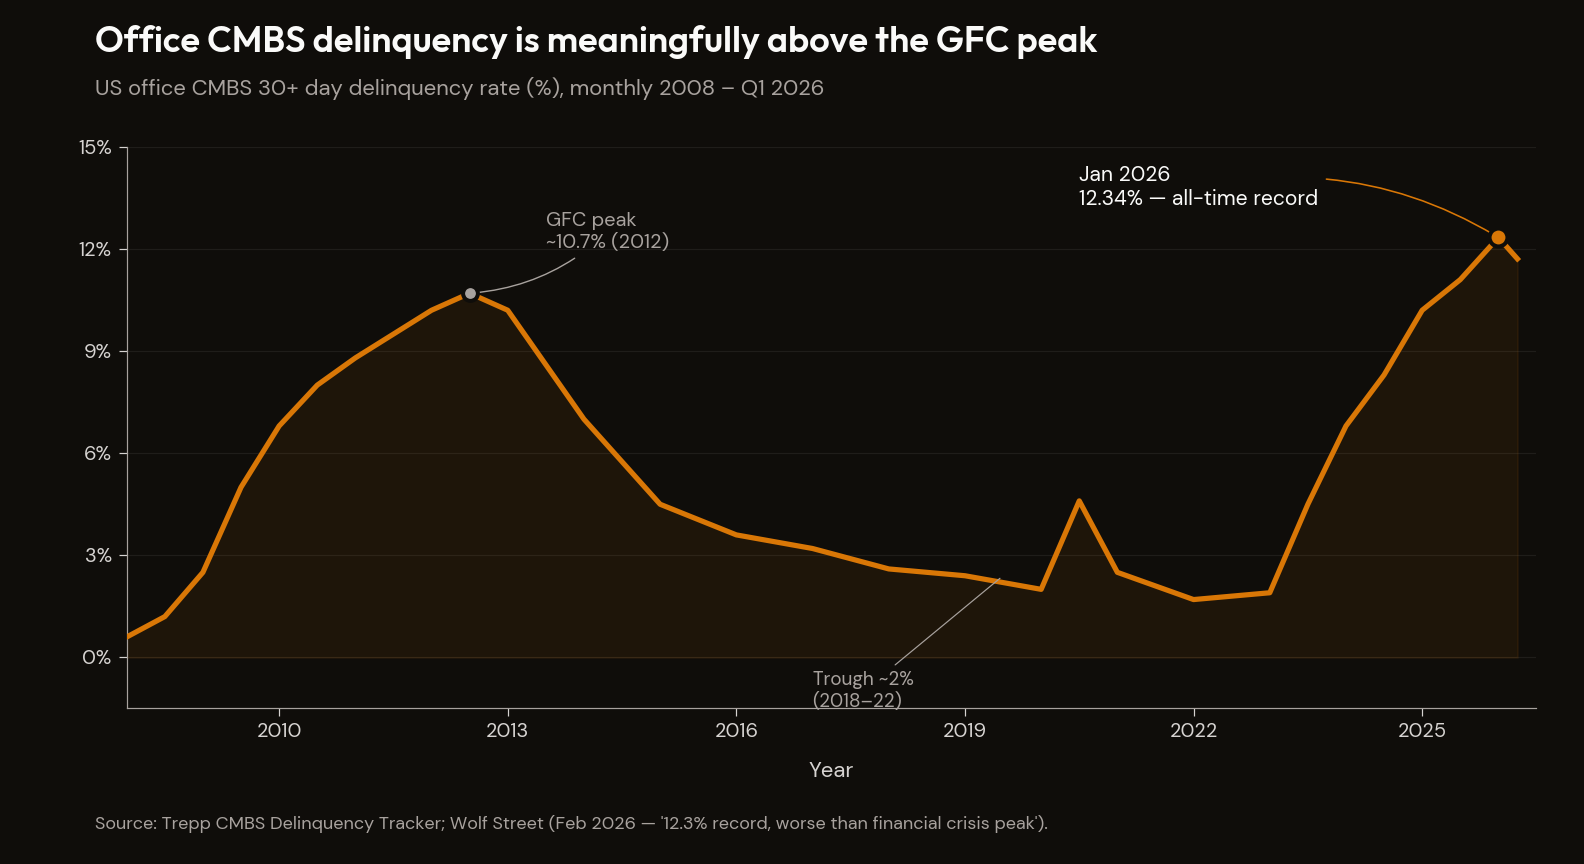
CRE debt maturing in 2026 is estimated at approximately $1.5 trillion or above (Trepp, MBA, RCA ranges vary with rolling re-classifications). Office CMBS delinquency was running at 12.34% in January 2026, meaningfully above the 2008-crisis peak of approximately 10.7%.24 Regional banks hold more than 70% of US CRE exposure, concentrating the credit-transmission channel in mid-size institutions without the balance-sheet depth of the money-centre banks. Approximately $25 billion of US office CMBS debt sits past its maturity date as of Q1 2026.
The transmission mechanism is well documented. Regional bank capital is impaired by CRE loss recognition; the bank tightens lending standards across its full portfolio; small-business credit contracts; local employment contracts; consumer stress deepens. The 2023 SVB / Signature / First Republic sequence demonstrated the speed at which concentrated regional-bank stress becomes a system event when the trigger is recognised. CRE in 2026 is the entire regional-bank sector's problem, arriving in a 12–18 month window that overlaps with Howell's refinancing wall.
The honest counter is the broader extend-and-pretend question taken up in Section IX. For CRE specifically: amend-and-extend works until the maturity wall and the liquidity cycle cannot both be navigated simultaneously. The maturity wall is mechanical; the liquidity cycle, per Howell, has now peaked. The next amendment requires a lender willing to extend into a market where collateral values are still declining and refinancing costs are still rising — a lender harder to find at the top of Speculation than in the Calm phase that preceded it. The canary is being asked to fly in 2026 against a regional-bank capital base that has now absorbed three years of mark-to-model deferral.
VII. JGBs — The Demographic-Sovereign Channel
The Japan crack has been documented in detail upstream — the BOJ holds 49% of all JGBs outstanding, the BOJ balance sheet sits at 99–101% of GDP, and 30-year JGB yields are at multi-decade highs as of Q1 2026.7 This section develops the transmission mechanism that connects Japan's domestic sovereign stress to the US Treasury market.
The BOJ's yield-curve-control policy held JGB yields artificially low for nearly a decade by purchasing government bonds in quantities that eventually reached approximately half the outstanding stock. When YCC was abandoned in 2024, the BOJ stepped back; the unwinding has been gradual but the direction is set. Private domestic investors — life insurers, pension funds, regional banks — had been net sellers of JGBs for years, preferring foreign bonds (primarily US Treasuries) for higher yields. As JGB yields have risen, the yield differential has narrowed, reducing the incentive to hold foreign assets. Japanese institutional investors repatriating capital to domestic JGBs sell foreign bonds to do so. The primary foreign bond held by Japanese institutions is the US Treasury.
Japan is the world's largest foreign holder of US Treasuries. When Japanese institutions repatriate, they are selling the world's largest source of dollar-denominated repo collateral. The JGB-Treasury link is the mechanism by which Japan's domestic sovereign stress becomes a global sovereign stress — one of the less-discussed transmission channels of the convergent-timing window in which BOJ normalisation, JGB repricing, and the US Treasury maturity wall arrive simultaneously.
The honest counter is the cry-wolf argument: the JGB market has been broken on every reasonable analytical metric for thirty years and nothing catastrophic has happened. The counter is empirically strong for the 2010–2024 period. What has changed is the saturation point: BOJ ownership at 49% of the stock is a hard ceiling beyond which the pricing mechanism is effectively destroyed. YCC was abandoned in 2024 because the BOJ was approaching that ceiling, not on macro grounds. The 18-year high in the 30-year JGB yield is the first indication that the pricing mechanism is reasserting itself; what makes it a global concern rather than only a domestic Japanese concern is the repatriation channel.
VIII. The Consumer Balance Sheet — Cross-Reference to The Math Doesn't Work
The consumer balance sheet is bifurcating. The aggregate prints conceal a K-shape in which the median household is already in recession while the top decile carries the headline numbers; the household-balance-sheet thread is developed in detail in The Math Doesn't Work, with the BNPL escalation, the New York Fed's Q4 2025 household-debt-and-credit data ($18.8 trillion total household debt, $1.28 trillion credit-card balances, aggregate delinquency at 4.8%), subprime auto 60+ day delinquency at a 32-year high, and the Pomboy K-shape framework giving the diagnosis its empirical grounding.
The connection-thesis point for this essay is narrower. Consumer stress connects to Mag 7 revenue through the consumer-revenue concentration documented in The AI Reckoning: consumer stress reduces the revenue base that funds the AI capex cycle. The top 10% of US earners now account for nearly half of all consumer spending — the highest share in the modern series. If the consumption driving the Mag 7's consumer-revenue base is increasingly concentrated in the top quintile, and if the top quintile's consumption is in turn driven by the wealth effect from equity markets — which are themselves sustained by the mechanical bid from passive flows — then the consumer revenue base of the world's largest companies is supported by a chain that terminates in a mechanical process that has now peaked.
Howell's refinancing wall worsens this directly and asymmetrically. Households refinancing variable-rate debt or rolling maturing fixed-rate mortgages face higher rates. Corporations facing higher refinancing costs cut labour or hiring decisions before they cut capital spending. The bottom three quintiles absorb both effects first and most. The consumer crack is therefore not a standalone diagnosis. It is the transmission channel through which the liquidity vector reaches the revenue base of the most concentrated equity market in modern history.
IX. AI Capex — Cross-Reference to The AI Reckoning
The AI capex cycle has its own internal clock that converges in the same window. The full treatment is in The AI Reckoning. The connection-thesis point for this essay: capex of the magnitude now being deployed — approximately $725 billion in 2026 hyperscaler spending,25 above the 2–3% of GDP threshold beyond which the historical record identifies accelerated capital-destruction risk — peaks and plateaus, typically within two to three years of a step-change. The plateau is visible in 2026–2027. The fiscal consequence of funding AI capex at competition scale sits in the same window as the sovereign debt maturity wall, by the same forced-choice logic Luke Gromen's framing names. AI capex connects to sovereign debt service through the fiscal posture required to subsidise it. That is the pick-one trap. It is the AI-capex sub-reading of the meta-clock.
X. The Counter-Arguments
The framework's strength is the honesty with which it engages its objections. Two counters need to be addressed at the architectural level, and each one is real.
"Extend and pretend has worked for three years. Why does this round fail?"
The counter is empirically correct on the prior three years: through 2023–2025, amendments multiplied, defaults were managed off the headline series, the CRE maturity wall was renegotiated rather than crystallised, and the system absorbed the stress at the price of a building shadow obligation.
The answer is that the structural conditions enabling each prior round of absorption are now different. First, the liquidity vector has reversed. The 2023 and 2024 rounds occurred in the Rebound and Calm phases of Howell's cycle, with liquidity expanding and collateral values stabilising. The 2026 round is occurring at the cycle peak. The next amendment requires a lender willing to extend into a market in which collateral values are still declining and refinancing costs are still rising — structurally harder in the Speculation-to-Turbulence transition.
Second, the regional-bank capital base has now carried three full years of mark-to-model accommodation. The buffer that allowed banks to defer recognition in 2023 against expected normalisation has been used. The 2026 cohort of CRE maturities arrives at a moment when the marginal regional bank's capacity to extend is materially lower than it was in 2023.
Third, the private-credit shadow obligation has been accumulating rather than dissolving. PIK-by-amendment rolled cash interest into principal at terms that assumed repayability at maturity. The maturity ladder it built arrives in the same 2026–2028 window as the CRE wall and the sovereign refinancing wall.
Fourth, the insurance-mediation channel is itself approaching saturation on actuarial mandates and ALM modelling capacity. Regulatory tolerance for further expansion at higher shadow-default rates is the binding constraint, and it tightens as the headline-to-shadow gap widens.
None individually makes the 2026 round impossible. The composite of all four operating simultaneously — at the liquidity-cycle inflection — is what differentiates it from prior rounds.
The 2020 Fed-intervention counter
The most important counter to the regime claim, and the one this manuscript cannot wave away in one sentence. In March 2020, the Treasury market briefly stopped functioning. The mechanism was forced selling and a co-movement signal that drove the "safe" asset to sell alongside the risky assets — the classic phase-transition signature applied to the most theoretically uncorrelated leg of every diversified portfolio. The Fed's intervention worked. Unlimited Treasury purchases, multiple credit facilities, roughly $4 trillion in balance-sheet expansion in a matter of weeks. The phase transition was arrested before it cascaded.
If the 2020 backstop worked in conditions that satisfied the framework's precursor signature, the question is real: what is structurally different about 2026–2027 that prevents a 2020-style intervention from working again?
The honest answer has three components, and the first is a concession. Acute liquidity provision is not the binding constraint. The Fed can do in 2026 what it did in 2020 — open the swap lines, expand the balance sheet, absorb forced sellers, place a floor under specific markets. Nothing in this manuscript argues that the Fed has lost the capacity to provide unlimited dollar liquidity to acute market freezes. Bank Term Funding Programme 2023 demonstrated the toolset still operates. If 2026 produces a SVB-style acute moment, the BTFP analogue will fire and the moment will be arrested.
The deeper point is the Hunt asymmetry. As an economy becomes heavily indebted, additional money supply ceases to translate into nominal growth: money circulates more slowly, multiplies less, and the transmission mechanism through which monetary easing reaches the real economy breaks under the weight of the debt it is supposed to dissolve. Lacy Hunt at Hoisington has been documenting the mechanism for forty years, building on Irving Fisher's 1934 mea culpa.26 Velocity peaked at 2.20 in Q4 1997 and now sits around 1.30 — a multi-decade collapse in the rate at which money circulates through the real economy.27 Each additional dollar of federal debt now generates approximately $0.31 of GDP, against $0.37 in 2007 — a 16% decline in the marginal productivity of debt across a decade in which total debt rose substantially. The structural conclusion is asymmetric monetary policy:
"And so, what happens when you become extremely over-indebted, monetary policy's capabilities become asymmetric. If the Fed wishes to tighten conditions, the monetary policy still works. But in this circumstance such as we have today, where the economy is extremely over-indebted, the debt is highly unproductive, and we can have objective verification of that, the velocity of money falls."
— Lacy Hunt, Grant Williams The End Game, Episode 6, August 9, 202028
Hunt's framework, taken alone, predicts disinflation rather than the fiscal-dominance inflation the diagnostic block treats as the operative risk. The tension is real, and the resolution is in the Demographic Crunch essay: Goodhart and Pradhan's labour-supply reversal is what bridges Hunt's velocity argument to fiscal-dominance inflation. Without the labour-supply tightening that the synchronous developed-world working-age peak produces, Hunt alone predicts ongoing disinflation as the velocity collapse continues. With the labour-supply tightening, the velocity collapse blocks the conventional easing channel while the labour-supply reversal pushes nominal wages and goods prices up — fiscal-dominance inflation arrives not because the Fed produces it but because the demographic mechanism delivers it through a transmission channel Hunt's framework leaves uncovered. The labour-supply mechanism is doing the work Hunt's velocity argument leaves uncovered. This is the reconciliation: Hunt's velocity collapse is right about the easing channel; Goodhart-Pradhan's labour-supply reversal is right about why disinflation is not the resolution.
This is the structural difference between 2020 and 2026. In 2020, the Fed's intervention worked because the binding constraint was acute liquidity — a single-vector shock that the balance-sheet expansion could absorb without triggering the inflation-and-credibility cost. The intervention bought time, and the underlying economy (briefly) absorbed the time-extension into a return to spending and credit creation. The velocity decline through 2020–2022 and the inflation that followed are the empirical record of what that absorption cost.
The 2026 configuration is different in three structurally important ways. First, the Fed enters from a starting balance sheet that is already substantially larger than its 2020 starting point, having only partially run off the 2020 expansion. The room for further expansion before triggering the currency-credibility cost is narrower. Second, the constraint is not a single acute moment. It is the convergent $40 trillion refinancing wall arriving in the same window as a JGB repricing, a CRE loss realisation, a private-credit shadow-default resolution, and a consumer-balance-sheet stress event. The Fed can place a floor under any one of those markets. It cannot simultaneously absorb the duration-mismatch loss in the regional banking system, the rollover stress in private credit, the foreign-Treasury sell-down on JGB repatriation, and the maturity-wall pressure on Treasury issuance, without monetising quantities of debt that trigger the dollar-credibility cost Gromen's forced choice identifies. Third, the velocity-collapse threshold means that the easing-side intervention cannot generate the nominal growth that would dissolve the maturing stock at higher real rates. The 2020 intervention worked through liquidity and through the subsequent inflation; the 2026 intervention can supply the liquidity, but the inflation channel is now constrained at the upper bound by the bond-market response, and the growth channel is constrained at the lower bound by velocity.
The Fed can prevent a cascade. It cannot do so without adding to the sovereign fragility that is itself the terminal constraint. That is not a failure of competence. It is a structural constraint on what any central bank can do in an economy that has crossed the velocity-collapse threshold and faces a refinancing wall on a calendar it cannot move.
The orthodox-monetary-policy faith — the Fed will simply restart QE at sufficient scale — is partially correct on the liquidity dimension and structurally wrong on the growth dimension. The AI productivity counter — that if AGI arrives by 2027–2028 and productivity compounds at 30% per year, nominal growth outpaces debt service — runs into Acemoglu's empirical ceiling (≤0.66% TFP over 10 years)29 and into the Stanford Canaries cohort showing a 13% relative decline in AI-adjacent entry roles rather than a productivity surge.30 The pick-one trap is the same forced choice in a different domain.
The 2020 intervention is the strongest case for the orthodox view. It is engaged here on its strongest grounds, and the answer is structurally that the conditions that made 2020 work — a single-vector shock, balance-sheet room, and a velocity-and-growth response — are not the conditions in 2026.
XI. Where the First Domino Falls — Not Picked
The historical pattern is consistent: the first domino is rarely the largest fragility in the system. It is the fragility that is first to reach a threshold where a small perturbation becomes a cascade trigger, and the least defended by the institutional backstop mechanisms available.
In 2008, subprime was not the largest fragility — the GSE balance sheets were vastly larger. It was the fragility that reached threshold first, and the one for which the Federal Reserve and Treasury did not have a ready-made backstop. The GSE backstop was invoked later, after the cascade had already started. The order of events was determined by the order in which threshold met an unprepared backstop.
The candidate fragilities in the current configuration — private credit, CRE, JGBs, consumer, AI capex — are each independently diagnosable. Each is also coupled to the others through the dollar-liquidity vector, through shared lenders and shared collateral structures, and through a common timing constraint that arrives in the 2026–2027 window. This essay's discipline is not to pick. The first domino is the least-defended fragility in the highest-pressure moment; that determination requires real-time information not available in May 2026. What this essay offers is the framework, the signatures, the historical pattern, and the empirical inventory of where the curvature is most negative in May 2026.
The integrated reading: the system is in the precursor regime; the precursor regime is detectable in advance through co-movement, fragility curvature, and log-periodic precursor patterns; the cracks are not separate but are coupled to a single liquidity vector whose meta-clock has peaked; the four sub-readings — private credit, CRE, JGBs, consumer, AI capex — hang off that meta-clock and arrive on its calendar; the absorption mechanisms that worked across 2023–2025 face structurally different conditions in 2026; the 2020-style intervention can prevent a cascade but cannot, under the velocity-collapse constraint, generate the nominal growth that would dissolve the underlying load; the question the regime diagnosis leaves open is which specific fragility tips the system through the phase transition.
That question is mechanical, not theoretical.
The math is the math. The timing is the question.
Footnotes
-
Yaneer Bar-Yam and the New England Complex Systems Institute working-paper record on cross-equity co-movement as a criticality signature, available via the NECSI publications portal. Bar-Yam published working papers on this co-movement metric in 2007 and 2008 (NECSI). Bar-Yam, Making Things Work: Solving Complex Problems in a Complex World (NECSI Press / Knowledge Press, 2004) develops the conceptual frame. ↩ ↩2 ↩3
-
Nassim Nicholas Taleb, "Antifragility, Robustness, and Fragility Inside the 'Black Swan' Problem," working paper: arxiv.org/abs/1108.1119. The h″(x) < 0 fragility formulation is elaborated mathematically in the paper and in the Technical Appendix of Antifragile: Things That Gain from Disorder (Random House, 2012). ↩ ↩2
-
Didier Sornette and colleagues, ETH Zurich Financial Crisis Observatory — public prospective record of log-periodic power-law (LPPL) fits and bubble warnings: ETH Zurich Entrepreneurial Risks chair. Methodology developed in Sornette, Why Stock Markets Crash: Critical Events in Complex Financial Systems (Princeton University Press, 2003) and the Physica A series from 1997 onward. ↩ ↩2
-
Motley Fool — Magnificent Seven S&P 500 Tracker (April 14 2026). ↩
-
Treasury Financial Report of the United States Government, FY2024 — Statement of Long-Term Fiscal Projections. ↩
-
Bank of Japan — Statistics (BOJ Accounts; Outright Purchases of JGBs). ↩ ↩2
-
Markus K. Brunnermeier, "Deciphering the Liquidity and Credit Crunch 2007–2008," Journal of Economic Perspectives 23, no. 1 (2009): 77–100 — aeaweb.org/articles?id=10.1257/jep.23.1.77. ↩ ↩2
-
Tobias Adrian and Markus K. Brunnermeier, "CoVaR," American Economic Review 106, no. 7 (2016): 1705–1741 — aeaweb.org/articles?id=10.1257/aer.20120555. ↩
-
Michael Howell, Capital Wars (Palgrave Macmillan, 2020); CrossBorder Capital — Capital Wars Substack. ↩
-
Michael Howell, "Global Liquidity," Capital Wars Substack. ↩
-
Roger Montgomery — "Navigating Liquidity: Michael Howell's 2026 Outlook" (January 2026). ↩
-
Yahoo Finance — "Bitcoin, Gold, Real Estate Are Key Inflation Hedges Before 2026 Downturn, Expert Warns" — summarising Michael Howell's 2026 outlook. The sector-decomposed framing of the $40 trillion figure is the aggregator's tidy-up; Howell's primary writing on the rolling-stock load is at Capital Wars Substack. ↩
-
Ray Dalio, Principles for Dealing with the Changing World Order: Why Nations Succeed and Fail (Avid Reader Press, 2021). The four-lever framework appears throughout the historical case studies (Weimar, late Bourbon France, late Habsburg Spain, Argentina 1980s/2001, UK 1976) and is most cleanly summarised in Chapter 4. Dalio's ongoing analysis at LinkedIn and economicprinciples.org refines the framing for the current US configuration. ↩
-
Fitch Ratings — US Private Credit Default Rate Continues Upward March to 5.8% in January 2026 (February 2026). ↩
-
Proskauer 2025 Private Credit Restructuring Year in Review. ↩
-
Bloomberg — Apollo and Wall Street private equity bet on America's life insurance. ↩
-
Hoisington Investment Management — Quarterly Reviews and Outlook. Lacy Hunt's debt-disinflation framework — velocity collapse, asymmetric monetary policy, marginal-revenue-product-of-debt — is developed across Hoisington's quarterly investment-outlook publications and built on Irving Fisher's 1934 Econometrica article, "The Debt-Deflation Theory of Great Depressions." ↩
-
Federal Reserve Bank of St. Louis — Velocity of M2 Money Stock (M2V), FRED series. Velocity peaked at approximately 2.20 in Q4 1997; recent readings around 1.30. ↩
-
Lacy Hunt on The End Game, Episode 6 — Grant Williams podcast (August 9, 2020). Official transcript PDF. Quote restored to transcript order; an earlier manuscript draft reordered sentences and appended a fabricated closing parallel ("But if the Fed tries to loosen, it cannot stimulate growth") which does not appear in the transcript. ↩
-
Brynjolfsson, Chandar, Chen — Canaries in the Coal Mine (Stanford Digital Economy Lab, Aug 2025). ↩