The Demographic Crunch
In 60 seconds
The post-1980 era of disinflation and asset-price expansion was driven by a one-time doubling of the global labour supply. That tailwind has reversed in every major developed economy. Japan ran the experiment to completion — 34 years, the most aggressive monetary regime in central banking history, real residential property −36% from peak. The US is on the same curve, held off only by immigration policy that is now politically contested.
The single sharpest sentence available about the developed-market asset-price regime of the next two decades is also the simplest. As of the fourth quarter of 2025, real residential property prices in Japan, measured against the Q1 1991 peak by the Bank for International Settlements, sit thirty-five point nine percent below that peak. Thirty-four years. No real recovery.1
That is the bridge between this essay and the one that came before it. The End of the Bull Run set out the arithmetic by which the aggregate US equity market is priced at valuations the underlying economy has never had to support. The argument was structural rather than cyclical, and it left a question unanswered. What is the structural condition that has to underwrite the implied forward returns? What is the macro mechanism that determines whether corporate cash flows in the next decade resemble the cash flows of the last decade, or something materially different?
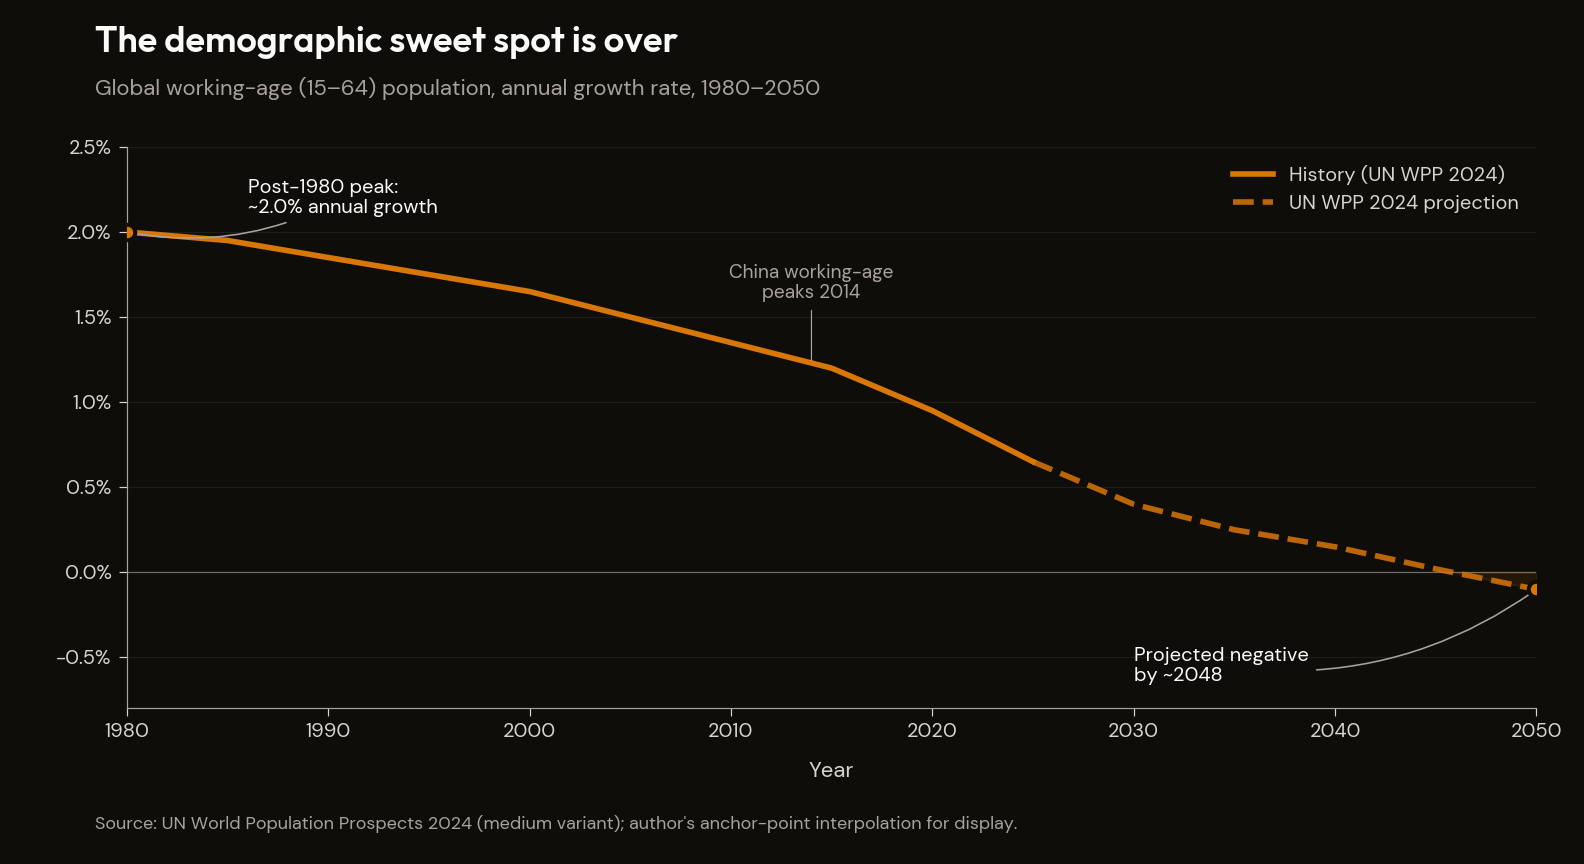
This essay names that mechanism. The post-1980 era of declining inflation, declining real rates, declining wage share of national income, and rising asset prices was not the achievement of central bank credibility, monetary innovation, or the policy choices of any individual administration. It was the consequence of a one-time doubling of the global effective labour supply — the integration of China and Eastern Europe into the world trading system, layered onto a one-generation expansion of female labour-force participation in the developed world. That supply shock suppressed wages, suppressed goods inflation, compressed the wage share of income, and pushed the residual flow into financial assets. The asset-price boom of the post-1980 era was the demographic sweet spot expressed in market prices.
That tailwind has reversed. China's working-age population peaked in 2014 and has fallen by sixty-eight million people since. South Korea's working-age cohort peaked around 2016. Japan's working-age cohort peaked in approximately 1995 and has lost roughly fifteen percent of its size in the three decades since. Italy's working-age population peaked in the early 2000s. Germany's is held flat only by sustained immigration. The United States is the last major developed economy in which working-age population is still rising — and only because of immigration whose political cost is now, by any reasonable assessment of the polling and the policy direction, mounting.2
The mechanism by which demography drives asset prices is direct, and it is mechanical rather than psychological. Workers, in aggregate, save a portion of their income and direct that saving into financial and real assets. Retirees, in aggregate, do the opposite: they net-sell financial and real assets to fund consumption that exceeds their pension income. When the working cohort is large relative to the retiree cohort, marginal price-setting in asset markets is net-bid. When the retiree cohort exceeds the worker cohort, and the worker cohort is not being replaced fast enough at the bottom to refresh the demand side, marginal price-setting flips from net-bid to net-offer. The flip does not require a recession to manifest. It does not require a credit event. It does not require a policy mistake. It only requires demography to keep doing what it has been doing for thirty years.
The previous essay made the equity-aggregate version of that claim. This essay makes the macro-mechanism version. Japan ran the experiment. The experiment took thirty-four years and the asset prices have not recovered in real terms. That is not a forecast. It is a completed case study. The argument the essay walks through is whether the rest of the developed world is on the same curve, and whether the United States — where the question is most contested — actually escapes it.
The conclusion, briefly stated up front: every developed economy except the United States is somewhere on Japan's curve, the institutional differences are smaller than the demographic similarities, and the United States does not escape the curve so much as trade the asset-deflation problem for an immigration-politics problem. That second problem is the subject of a later essay. The first problem is the subject of this one.
I. The question
Demographics has, until recently, been treated as a slow-moving variable that did not matter for cycle analysis. Population structures change on generational timeframes; cycle analysis operates on horizons of months to a few years. The two scales appeared not to interact, and so the practising macroeconomist could safely set the demographic variable aside and concentrate on what the central bank was doing, what the fiscal balance was doing, what the credit cycle was doing.
The frame I take from Charles Goodhart and Manoj Pradhan's The Great Demographic Reversal (2020) is that this neglect was a mistake hiding in plain sight, and the language of post-1980 monetary economics gets the causation backwards.3 The disinflation of the 1980s and 1990s was attributed to the credibility of independent central banks; it was driven in substantial part by two billion workers entering the integrated global trading system. The compression of the equity risk premium and the secular rise in asset prices were attributed to post-Volcker monetary policy; they were driven by the same labour-supply expansion compressing the wage share and routing the residual into capital. The era of low and falling real rates was attributed to a "savings glut" in the abstract; the glut had a specific demographic origin in the working-age expansion of the emerging-market exporters.
None of this means the central bankers were unimportant; it means they were tailwind-riders rather than wind-makers, and when the tailwind reverses the language stops working. The post-2020 inflation episode is the leading edge of a structural regime change — aging, retiring, dis-saving cohorts producing goods inflation by consuming without producing while simultaneously producing asset deflation by net-selling the financial assets they accumulated during their working years — and the disinflation since 2023 is partial and cyclical, with the underlying regime intact and reasserting itself over the next decade.
Where this essay departs from Goodhart-Pradhan is in two places. First, the framework gives heavy weight to wage inflation as the channel of structural pressure; the AI-displacement evidence in The Math Doesn't Work suggests the wage-share recovery they expect is being cut off at the cohort level for exactly the workers whose wage gains would otherwise be the mechanism. The structural reversal G-P describe runs through asset-price deflation more cleanly than through wage inflation in the US case. Second, G-P treat immigration as a quantitative offset that several economies (the US, the UK, Germany) can deploy at scale. I think the post-2025 political reality has substantially closed that offset for at least the US, the UK and large parts of Western Europe — making the convergence to the Japanese / Korean / Italian trajectory faster than the framework's base case would imply.
This essay adjudicates the dispute on the case studies in which the regime has had time to mature: Japan, where the experiment is complete; Korea, where the trajectory is sharper; China, where the case is largest in absolute scale; and the Western European economies where the same mechanism is partway through its work. The question is not whether the demographic mechanism is real — the Japanese case settles that. The question is whether the institutional, technological, or immigration variations across countries change the destination, or only the timing.
II. The tailwind that was
Begin with the mechanism that drove the post-1980 era, because the reversal is unintelligible without it.
Between approximately 1980 and 2015, the integrated global labour supply roughly doubled. Three flows produced this. The first was the integration of China into the world trading system, beginning with the post-1978 reforms, accelerating after Deng's 1992 southern tour, and reaching its full expression with China's WTO accession in 2001. By the mid-2010s, China contained an industrial workforce of roughly four hundred million, almost all of which had been outside the integrated trading system in 1980. The second was the post-1989 integration of Eastern Europe and the former Soviet bloc, which added a hundred-million-plus workforce to the European trading area. The third was the secular rise of female labour-force participation in the developed world, which roughly doubled the female participation rate over the post-war period and was substantially complete by the early 2000s. None was a recurring tailwind. Each was a one-time level shift.
The labour-supply expansion was the proximate cause of the macro regime that followed. With effective labour supply growing faster than effective labour demand, the wage share of national income compressed across developed economies. Real wage growth in the developed-world median worker decoupled from productivity growth, in some economies for the first time since the post-war period. With wage growth suppressed, goods inflation was suppressed; central banks could run accommodative policy without consumer-price consequences. With the wage share compressed, the profit share rose; the residual flow ran through corporate margins and into financial assets, supporting an unprecedented multi-decade compression of the equity risk premium. The era of low real rates was not, primarily, a story about central bank policy or a generic global savings glut. It was a story about the savings of an enormous, young, working-age population in China and the emerging-market exporters being recycled into developed-market sovereign and corporate bonds at scale.
Goodhart and Pradhan's framing throughout The Great Reversal is that the demographic sweet spot of the post-1980 period is over, and that the next three decades will look more like the 1970s than the 2010s — only worse, because the underlying demographics are weaker now than they were then.
The next regime — upward pressure on goods inflation, upward pressure on the wage share, downward pressure on the profit share, downward pressure on financial-asset prices — is a description of what happens when the underlying configuration runs in the opposite direction. Goodhart's November 2025 NBP keynote added the corollary that the era of independent central banks may itself end with the demographic regime that justified it, because central banks designed to fight inflation in a labour-surplus world cannot survive a regime in which the inflation pressure comes from labour scarcity colliding with fiscal expansion neither side can absorb.4
The corollary is consequential. Central banks face an impossible mandate in the new regime, because the demographic forces driving goods-side inflation are the same forces driving fiscal expansion. To fight the inflation by raising rates is to crush the fiscal flow that is now structurally required to support an aging population. To accommodate the fiscal flow is to validate the inflation. The independence of the central bank — which was institutionally designed for a regime in which the macro tailwinds did the central bank's work for it — does not survive the regime in which the tailwinds reverse. The Math Doesn't Work identified this fiscal arithmetic on the entitlement side: the worker-to-beneficiary ratio falling from sixteen-to-one in 1950 to roughly two-and-a-half-to-one today, against an OASI trust fund that exhausts on a CBO-projected timeline.5 6 That arithmetic is the demographic mechanism made fiscal. The same mechanism running through corporate margins and asset prices is the version this essay describes.
There is a developed-world equity-market analogue to the bond-market savings-glut mechanism. The same demographic configuration that recycled emerging-market savings into developed-world sovereign debt also produced the equity-market mechanical bid (anchored in The End of the Bull Run). The reversal of the demographic curve runs through the same channel: required minimum distributions, retirement-cohort reallocation, and eventual net withdrawals, mechanically symmetric to the curve that built the bid.
What the next sections walk through is the proof that the mechanism is not theoretical. It has run, to completion, in one major developed economy already.
| Country | TFR (2024) | Working-age peak year | Real asset return since peak | Status |
|---|---|---|---|---|
| Japan | 1.37 | ~1995 | −35.9% residential property; 0.24% real annualised Nikkei 1989–2023 | Experiment complete |
| South Korea | 0.72 | ~2016 | KOSPI +35–45% real 2010–25; breadth deteriorating | Trajectory accelerating |
| China | ~1.05 | 2014 | CSI 300 flat real since 2014; Tier-3 property −30–45% real | Live case, scale |
| Italy | 1.14–1.20 | ~early 2000s | FTSE MIB 0.7–1.1% real annualised 2000–25 | Two decades in |
| Germany | ~1.45 | Held by immigration | DAX 2.8–3.2% real annualised 2000–25 | Partial offset via migration |
| United States | 1.62 | Not yet — held by immigration | (the configuration this manuscript describes) | Earliest on the curve |
III. Japan — the completed experiment
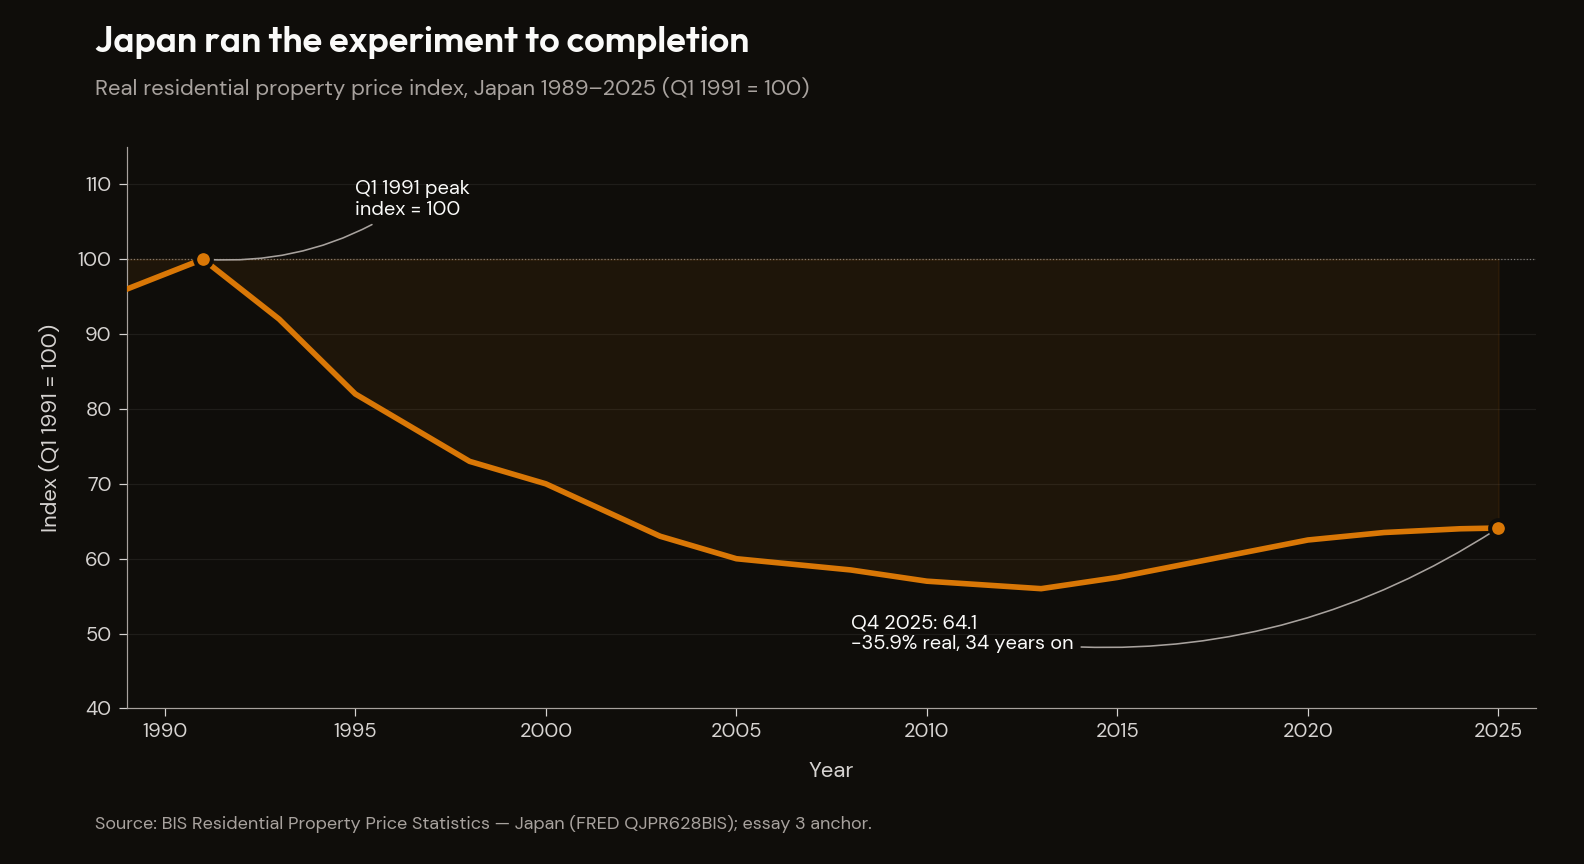
Japan is the case in which the demographic mechanism has had the longest time to mature, and in which the policy regime has had the longest time to attempt to offset it. The result, after thirty-four years of fiscal expansion, zero rates, negative rates, yield curve control, and unprecedented quantitative easing, is the −35.9% real residential property datum that opened this essay.
The demographics first. Japan's TFR fell from 2.13 in 1970 to 1.57 in 1990 — the figure that produced what is still called the "1.57 shock". The 2025 figure is approximately 1.37, with annual births at a record low of roughly 686,000 in 2024.7 Total population peaked in October 2008 at 128.1 million; it now sits at 123.7 million. The working-age population peaked around 1995 at 87.3 million; it now sits at 73.7 million — 15.6% below its peak. The old-age dependency ratio was 17.4% in 1990; it is approximately 50% today. One retiree is now supported by approximately two workers.2
What did the asset side do?
The Nikkei 225 peaked at 38,915 in December 1989. It reclaimed that nominal level in February 2024 — a thirty-four-year nominal round trip cited often as evidence that Japan's experience was less catastrophic than the crash narrative suggests. The nominal figure is misleading. The Nikkei's real annualised return from 1989 through 2023 was 0.239%, per Damodaran's NYU Stern series: essentially zero compounding over thirty-four years.8 The nominal recovery is a chart illusion produced by inflation eroding the denominator while the numerator stayed flat.
The property-market figure is harder to dispute. The BIS Residential Property Price Index Q4 2025 reading, indexed against the Q1 1991 peak as 100, is 64.1. That is the −35.9% real datum.1 Tokyo commercial real estate has partially recovered post-2013; residential property outside the major Tokyo wards has not. Urban land prices have been roughly flat in nominal terms since 2010 — sharply negative in real terms.
The natural objection that the 1991 starting point was a bubble peak has force on the residential property side but substantially less on the equity side, where the real recovery still required three and a half decades against an inflation rate that averaged below 1% for most of the period — closest in shape to the Dow Jones Industrial Average's 1929–1954 round trip, in an economy whose demographics were sharply different.
Japan's policy response, examined in retrospect, looks like the playbook every other developed economy has been borrowing from since 2008. The Bank of Japan cut rates to zero in 1999, ran negative interest rate policy from 2016 to 2024, maintained yield curve control. Fiscal policy ran sustained deficits; gross public debt now stands at roughly 260% of GDP, the highest in the developed world. The central bank monetised the issuance because no other domestic buyer existed at the rates the government required. The Bank of Japan today owns approximately 49% of all Japanese government bonds outstanding, and its balance sheet sits at roughly 99–101% of nominal GDP — a share no major developed-economy central bank has ever approached.9
The policy regime did everything the textbook said. It cut rates to zero. It cut them through zero. It bought the long end. It bought equities directly through the ETF channel. It expanded its balance sheet to a size unprecedented in modern central banking. None of it produced an asset-price recovery in real terms. The labour supply was contracting; the savings cohort was net-selling; the demographic flow ran in one direction and the policy interventions could only partially offset its momentum.
The Japanese case settles two questions and opens a third. The mechanism is real, and it has run for thirty-four years without exhausting itself. Monetary and fiscal policy can blunt it, can mask it nominally, and can prevent the disorderly collapse the 1989 peak might otherwise have implied — but they cannot reverse it. The third question — whether the mechanism is uniquely Japanese, or general — is what the next three sections take up.
IV. South Korea — the accelerated trajectory
If Japan is the completed case, South Korea is the case running in fast-forward.
Korea's total fertility rate fell to 0.72 in 2024, the lowest figure recorded in any major economy in the modern statistical era. The 2025 figure is 0.80 — a partial uptick that demographers are split on whether to read as signal or noise. (The 0.80 figure carries appropriate caution; if the uptick holds for 2026 it would weaken, slightly, the thesis that Korea is on Japan's curve at maximum acceleration.) For comparison, the replacement-level fertility rate is approximately 2.10. Korea's 2024 figure represents fertility at a third of replacement.10
The trajectory of the decline matters as much as the absolute level. Korea's TFR fell from 1.5 to 0.7 over roughly twenty years. Japan took approximately fifty years to fall from 1.5 to its current 1.37. Korea's fertility curve is approximately two and a half times steeper than Japan's. The total population peaked in 2020 at 51.8 million; the working-age population peaked around 2016 and is now contracting at roughly 0.6% per year, with the contraction rate accelerating. The structural cohort imbalance is more acute than Japan's at any equivalent stage of its transition.
The asset side has not yet entered Japan's deflation phase. The KOSPI has produced a cumulative real return of approximately 35–45% between 2010 and 2025, though most of that outperformance came from a narrow set of large-capitalisation names. Index breadth has deteriorated sharply: as of mid-2025, roughly 98.6% of KOSPI-listed stocks were trading below their ten-year highs. Seoul apartment prices peaked in Q3 2021, corrected approximately 15% in real terms through 2024, and recovered partially in 2025 on supply-cycle dynamics rather than demand-side strength.
The reason Korea has not yet entered the Japanese deflation phase is straightforward: Korea is in the early years of its working-age contraction. Japan in 2000 was in a roughly equivalent position — population just past peak, working-age cohort five years into contraction, asset prices having corrected sharply but the broader regime not yet locked in. The next decade in Japan was when the regime fully consolidated, and asset prices entered the long sideways grind that produced the Damodaran 0.239% real annualised number.
Korea's steeper trajectory does not mean Korea avoids the Japanese outcome. It means Korea reaches the equivalent of Japan's mid-1990s configuration five to ten years sooner, and that Korean asset prices have not yet repriced for that fact. When the repricing arrives, it is likely to be sharper than Japan's — the underlying demographic decline is more compressed, and the Korean policy toolkit is less developed than Japan's was in 1990. (Japan in 1990 had Bank of Japan independence, deep domestic capital markets, and a 65% household savings rate to work with. Korea has none of those at the same depth.)
The KOSPI breadth deterioration is the first faint signature. A market in which the top names mask the underlying decline of the median name is what an asset market produces when the underlying earnings base is bifurcating — the same K-shape pattern The AI Reckoning documents for the United States. The mechanism is not Asian; it is universal. Korea is the trajectory-acceleration argument: not that Korea will look like Japan, but that Korea will look like Japan sooner and with less margin to absorb the transition.
V. China — the live case at scale
China is running Japan's playbook in real time, at four times the population scale and with substantially worse policy options.
China's working-age population peaked in 2014 at 926 million; as of 2025 it stands at 858 million — a contraction of sixty-eight million in eleven years. Total population peaked in 2022 at 1.412 billion; 2024 alone produced a 3.39 million net decline.11 The TFR is estimated at approximately 1.05 nationally for 2024. The one-child policy aftermath has produced a structural cohort imbalance the 2015 policy reversal cannot reset, because the women who would be having children today were not born in the numbers required.
The CSI 300, the broadest measure of mainland Chinese equity prices, has produced cumulative real returns of approximately negative 25 to 30% from its 2007 peak, and has been roughly flat in real terms since 2014 despite the Chinese economy roughly tripling in nominal GDP over the same period. This is the Japanese pattern compressed: large nominal economic growth, no real equity-market participation in that growth.
The property side is more revealing. Chinese property prices, measured by BIS aggregations, have bifurcated sharply since 2021. Tier-1 cities are off roughly 5 to 8% in real terms from their 2021 peak. Tier-3 city prices are off thirty to forty-five percent over the same period.12 Tier-3 is where the working-age decline meets the property collapse most directly — cities that lost their younger cohort to Tier-1 migration and whose property-price sustainability depended on continued in-migration that has now reversed. Evergrande defaulted in September 2021; Country Garden in August 2023. Local government finance vehicles carry liabilities of approximately nine trillion dollars, collateralised in significant part on land sales whose underlying value is now revealing as impaired.
The K-shape inside China is worth pausing on. The same compositional pattern that The AI Reckoning documents in the United States — concentration of value at the top, fragility at the bottom — is visible inside the Chinese property and equity markets. Tier-1 cities are partially insulated; Tier-3 is where the demographic decline and the property collapse meet. The mechanism is the same; the institutional surface, in a one-party state with extensive capital controls and an opaque banking system, is wholly different. That the same K-shape pattern emerges across institutional systems this divergent is the strongest available evidence that the underlying force is demographic rather than institutional.
The standard Western consensus on China is that the country will manage through the transition by reform — liberalising the household registration system, reforming the LGFV financing structure, rebalancing toward consumption, allowing the renminbi to find a market-clearing level. The argument is reasonable on its own terms. It also misses the demographic point. Japan also reformed. Japan ran financial sector reform in the late 1990s and early 2000s, corporate governance reform under Abe, labour-market reform in fits and starts across the entire post-1990 period. The result, after thirty-four years of reform on top of the most aggressive monetary policy in modern central banking, is a real residential property price index 35.9% below peak. Reform is not nothing. It is also not enough to overpower a demographic configuration in which the working cohort is shrinking and the retiree cohort is expanding — and the reform agenda the Western consensus assigns to China runs through institutions that have actively resisted those reforms for two decades.
China's institutional disadvantages, relative to Japan, are if anything sharper — shallower capital markets, capital controls that have produced systematic mispricing of domestic assets, a banking system whose true asset quality is unknowable from the outside, a foreign-asset position constrained by political structure rather than by the savings rate. There is no clear analytical reason to expect China's outcome to be milder than Japan's. The mechanism is invariant to the institutions. The timing differs.
VI. Western parallels — Italy and Germany
The Western European cases are quieter, and for that reason more diagnostically useful: they show the same mechanism running through institutions that look more like the United States than like Japan or China.
Italy has been below replacement-level fertility since 1977. Its current TFR sits in the 1.14 to 1.20 range — the worst in the European Union.13 The Italian working-age population peaked in the early 2000s and has been declining at roughly 0.4% per year. Italian sovereign debt now stands at approximately 137% of GDP, sustained by ECB intervention.14 The FTSE MIB has produced real annualised returns of approximately 0.7 to 1.1% over the 2000–2025 period — two effectively lost decades, produced inside a Western institutional framework.
Germany is managing a similar demographic configuration with a different policy mix. The German TFR sits at approximately 1.45 in 2024, supported above the Italian level largely by immigration-origin populations; the native-born rate is closer to Italy's. The working-age population is projected to decline by approximately five million by 2035 absent sustained immigration.15 The DAX has produced real annualised returns of approximately 2.8 to 3.2% over the 2000–2025 period — better than Italy or Japan, but well below the historical norm. The German outperformance has two proximate sources: a stronger export base exposed to demographically younger Asian markets (a transitional benefit), and sustained immigration providing a labour-supply offset that Italy has not had access to at comparable scale — at a political cost the German polity has been re-litigating continuously since 2015.
What the Italian and German cases jointly demonstrate is that the demographic-asset-deflation channel is not an Asian phenomenon. It is not a function of Confucian-cultural family structures, of insular labour markets, of authoritarian one-party governance, or of any of the other features that Western commentators sometimes invoke to dismiss the Asian cases as inapplicable. It works through any developed economy with sub-replacement fertility and weak labour-supply offsets. The Italian case shows the mechanism running inside Western parliamentary institutions, free capital markets, and an open economy. The German case shows it partially offset by sustained immigration — at a political cost that has reshaped German party politics since 2015 and that the Merz government has continued to negotiate.
The mechanism is invariant to institutions. Only the timing differs. The asset-price record across Japan, Korea, China, Italy, and Germany differs in magnitude but converges in direction. There is no developed-economy counter-example.
The next section asks the question that the convergence forces. Where is the United States?
VII. The United States position
The United States is the apparent exception. The conventional framing is that the US escapes the demographic crunch through a unique combination of factors — higher native-born fertility than the European median, sustained immigration providing a labour-supply offset, a younger working-age cohort than any other major developed economy, and a corporate sector exposed to younger global markets through the multinational structure of the largest US firms. All four claims are factually true. None of them is sufficient.
Begin with fertility. The US total fertility rate stood at 1.62 in 2024, per the National Center for Health Statistics.16 This is below replacement, and below the level — 1.5 — that Lyman Stone's recovery-impossibility analysis identifies as the threshold below which sustained recovery has not historically been achieved without immigration.17 The headline number is also a composition story. The US TFR for non-Hispanic native-born populations has been running materially below 1.5 since the mid-2010s, and the aggregate has been held above that threshold by the higher fertility of Hispanic-origin populations and, to a lesser extent, by the foreign-born population generally. If the higher-fertility components compress toward the native-born median — as every prior immigration cohort in modern US history has, on a generational timeline — the aggregate TFR follows them down.
Move to immigration. The US working-age population has continued to expand through the 2010s and 2020s only because of immigration. Native-born working-age population growth went negative on a trend basis in the late 2010s and has remained there. The official Census projections for 2025–2050 are explicit that all US working-age population growth in the projection horizon is expected to come from immigration; without it, the US working-age population begins to contract within a decade and reaches Japanese-style decline rates by mid-century.18
This is where the US case becomes politically rather than demographically interesting. The immigration that sustains the US's apparent demographic advantage has, since 2015, been the most contested political issue in the country. The 2020 to 2024 period produced the largest sustained net migration inflow in modern US history, on the order of 2.5 to 3.5 million per year by some estimates; the policy response since early 2025 reversed the inflow direction sharply, with preliminary 2026 estimates pointing to net negative migration for the 2025 calendar year — the first negative reading since the early 1930s. The trajectory of US working-age population, in other words, is not a fact about demography. It is a function of immigration policy, and immigration policy is now one of the most volatile political variables in the system.
Sensitivity: US working-age trajectory under three immigration scenarios
| Scenario | Net annual migration | US working-age trajectory | Asset-deflation timing |
|---|---|---|---|
| Pre-2025 baseline | ~1.0–1.5M | Continued slow growth | Mechanism deferred 15–25 years |
| Current trajectory | ~0–0.5M | Plateau, then mild decline | Mechanism engages on European timeline (5–15y lag vs Italy) |
| Net-negative | <0 | Contraction (first since early 1930s) | Mechanism engages on accelerated timeline |
The Census projection horizon assumes positive net migration; the policy direction since early 2025 has reversed it.
The structural point is harder than the cyclical one. The United States does not avoid the demographic crunch. It trades the asset-deflation problem for an immigration-politics problem. If immigration continues at the rates of the early 2020s, the working-age cohort continues to expand and the demographic-asset-deflation mechanism is partially offset, at least for a generation. If immigration is curtailed at the rates implied by current policy, the working-age cohort begins to contract on the European timeline, and the mechanism this essay describes engages in the United States with a five-to-fifteen-year lag relative to Italy and Germany. There is no third option. The arithmetic does not allow one.
Egos and Ideology, later in this manuscript, takes up the political economy of immigration in detail. The argument here is that the immigration-politics question is the load-bearing variable for whether the United States experiences the asset-deflation channel on a Japanese, a Korean, an Italian, or a uniquely American timeline. It is not the project of this essay to litigate the immigration question on its political merits; the empirical literature is genuinely contested, the political salience is real, and the question deserves an essay of its own. What this essay claims is narrower. The US does not escape the demographic configuration that has produced the asset-deflation channel in Japan, Korea, China, Italy, and Germany. It is in that configuration as well, just earlier on the curve, and only by reference to a policy variable that is now politically unstable.
Lyman Stone's research at the Institute for Family Studies has documented the same pattern across the developed-world data:17 no country that has fallen below the 1.5 threshold has recovered to replacement on a sustained basis without immigration. The set of historical attempts is large enough that the empirical claim is robust — pro-natalist policy on its own has not reversed the trajectory in any modern developed-economy case.
Pro-natalist policy has been tried in serious form by Hungary, France, Sweden, South Korea, Japan, and a number of smaller economies. The result, in every case, has been a fractional, temporary, or compositional gain — never a recovery to replacement on a sustained basis in the absence of compensating immigration.
The implication for the US is direct. If immigration is curtailed and pro-natalist policy is offered as the substitute — which is, broadly, the policy direction implied by current political economy — the historical record on substitute efficacy is empty. The substitution is a slogan; the demographic record refuses to honour it.
That is the analytical floor under the entire argument. Demography is the slowest-acting macro force, but it is also the hardest to reverse. The question is not whether the developed world is on Japan's curve. The question is only how steep each particular country's section of the curve is, and whether any policy variable — immigration, productivity, family policy — can offset the slope before the asset-price implications work themselves through.
VIII. The honest counter-arguments
Four counter-arguments merit specific treatment.
"Productivity will compensate." Acemoglu's modelling caps AI's TFP gain at roughly 0.66% over a decade.19 The demographic drag on developed-economy growth runs in the multiple percentage points over the same horizon. Even granting Goldman Sachs's more optimistic 7% cumulative GDP gain, the demographic mathematics still produce net asset-deflation pressure for twenty years before productivity catches up. Goodhart's conclusion in The Great Demographic Reversal's seventh chapter is that productivity offsets are real but an order of magnitude smaller than the demographic drag.
"Immigration will solve it." Correct in arithmetic, incorrect in politics. The rates required to fully offset declining native-born fertility are politically infeasible at scale in every major developed economy that has tried them. The post-2015 European migrant crisis, the post-2020 US border surge, and the political backlashes that followed have rewritten the political map of the affected countries. Immigration is the only mechanism with the scale to neutralise the configuration; no developed-world political system has demonstrated the capacity to maintain it at that scale on a multi-decade horizon.
"Harry Dent was wrong, so the thesis is wrong." Dent's The Demographic Cliff predicted Dow 5,000 by 2017 — off by thirty thousand index points and a decade. Dent had the mechanism roughly right. He missed the offsetting tools: continued globalisation expansion, zero rate policy, quantitative easing, sustained fiscal expansion. Those tools blunted the mechanism without reversing it. They are now exhausted. G7 sovereigns sit at 100%-plus debt-to-GDP ratios; central bank balance sheets are at multi-decade highs; globalisation is running in partial reverse. The delay is not refutation; it is exhausted runway.
"Japan is sui generis." The counter has surface plausibility and does not survive comparison to the cases. Korea has produced a sharper version inside a substantially more open institutional structure. China has produced the same direction of pressure inside institutions that bear no meaningful resemblance to Japan's. Italy has produced approximately the same record inside Western parliamentary institutions. Germany is partway through a milder version inside Western institutions with sustained immigration. The defence requires explaining why the same direction of pressure manifests in five economies with five different institutional configurations. The simpler explanation is that the institutional surface is incidental and the demographic configuration is causal.
These four counter-arguments are the serious bullish defence. The first concedes the mechanism and disputes the magnitude; the magnitudes do not work in favour of the bull case. The second concedes the arithmetic and disputes the political feasibility, which has weakened materially in the past decade. The third dismisses an early forecaster's bad timing and ignores that the offsetting tools have since been exhausted. The fourth invokes cultural specificity and is refuted by the cross-institutional convergence. None of them removes the demographic configuration from its position as the controlling variable, and no developed-economy counter-example exists in the modern data set.
IX. Demography, the Slowest-Acting Force
The End of the Bull Run identified a starting valuation from which historical base rates do not produce the returns current prices have already promised, and deferred the structural question. This essay has specified it: the demographic configuration that has, in every developed-economy case it has matured, produced the asset-price outcomes the previous essay was asking US equity-market valuations to defy.
Japan has run the experiment to completion: thirty-four years of policy effort, the most aggressive monetary regime in central banking history, and a real residential property index 35.9% below peak. Korea is running it in fast-forward. China is running it at four times the population scale. Italy and Germany are running it inside Western institutions. The mechanism is invariant to the institutional surface; only the timing differs. The United States is on the same curve, with the trajectory of its position determined by immigration policy that is now the most volatile variable in the political system.
What is genuinely unknown is the timing. The demographic mechanism is the slowest-acting macro force; it works on horizons measured in decades rather than cycles. Japan's experiment took thirty-four years and is not yet complete. What is not unknown is the regime. The labour-supply tailwind that underwrote the post-1980 era of disinflation, low real rates, and rising asset prices has reversed. The asset-price implications are not a tail risk; they are the base case in every developed economy where the regime has had time to mature.
The regime, as in the previous essay, is what we should be looking at — the index price, the headline equity multiple, the official inflation reading, the central bank communication, are all the lagging variables. They are the last variables to acknowledge what the underlying configuration has already determined.
The demographic sweet spot of the past three decades is over. The next three decades will not look like the last three. Japan has shown what they look like instead.
Demography is the slowest-acting macro force, but it is also the hardest to reverse.
Footnotes
-
UN World Population Prospects 2024. Country-level working-age (15–64) population series; dependency-ratio projections. ↩ ↩2
-
Charles Goodhart and Manoj Pradhan, The Great Demographic Reversal: Ageing Societies, Waning Inequality, and an Inflation Revival (Palgrave Macmillan, 2020). Publisher page. LSE School of Public Policy working-paper version. ↩
-
Charles Goodhart — The Context for Future Monetary Policy, NBP keynote, 7 November 2025. ↩
-
Alliance for Lifetime Income — Peak 65 Zone Analysis; Census Bureau 2023 National Population Projections. ↩
-
Statistics Bureau of Japan — Population Estimates and Vital Statistics. ↩
-
Aswath Damodaran — Historical Returns: Stocks, T.Bonds & T.Bills with Premiums (NYU Stern); Damodaran international-index real-return datasets. ↩
-
Bank of Japan — Statistics (BOJ Accounts; Outright Purchases of JGBs). ↩
-
Statistics Korea (KOSTAT) — Births, Deaths and Fertility Statistics. ↩
-
China National Bureau of Statistics — Population Statistics. ↩
-
ISTAT — Indicatori demografici (Italian National Institute of Statistics). ↩
-
Eurostat — Government Debt and Deficit Statistics. Italian general-government gross debt ~137% of GDP. ↩
-
Destatis — German Federal Statistical Office, Population Projections. ↩
-
CDC National Center for Health Statistics — Births: Provisional Data for 2024. ↩
-
Institute for Family Studies — Lyman Stone publications. ↩ ↩2
-
US Census Bureau — 2023 National Population Projections. Working-age (18–64) projections 2025–2050; immigration as required contributor to positive growth. ↩