The End of the Bull Run
In 60 seconds
Cap/GDP above 250%, Shiller CAPE at 42, forward P/E above Marks's 23× threshold — three different vantages onto the same configuration: the index is at the most expensive valuation in modern US market history. The implied 10-year forward real return on the historical base rate is approximately zero, with the error bar mostly to the downside. The mechanical bid that built the regime reverses with required minimum distributions; the unwind does not require a recession or a discrete trigger.
The fiscal arithmetic that does not work for the United States Treasury also does not work for the United States stock market, and for the same reason: a balance sheet has been promised cash flows the underlying economy is not built to deliver.
That is the bridge between this essay and the one that came before it. The Math Doesn't Work set out the sovereign side of the picture — a federal balance sheet that compounds debt against a shrinking demographic productivity base, a maturity calendar that turns the abstract problem into a cash-flow problem, and an entitlement stack whose default position is the cut. This essay extends that diagnosis to the equity market. The aggregate index has been priced as if the regime described in Math Doesn't Work does not apply to it. It does. The fiscal regime that cannot deliver promised entitlement cash flows also cannot deliver the corporate cash flows that current S&P aggregate valuations require. The unwind of the second is, mechanically, the unwind of the first.
I have held some version of the bear position on US equities since 2021. I have been wrong on timing every year since. I am not going to call the date. I am going to describe the regime, set out the math, and let the reader decide what posture is appropriate to it.
What I am willing to claim is narrower. The aggregate S&P 500 is now at the most expensive valuation in modern US market history on three of the four measures with the longest historical track record of correlating with subsequent ten-year returns. The fourth — the cap/GDP ratio Warren Buffett once called "probably the best single measure of where valuations stand at any given moment" — exceeds its 2000 peak by roughly fifty percent. The arithmetic implied by those starting valuations, applied to the historical base rate, is a ten-year forward real return on the S&P 500 of approximately zero, with a wide error bar around it that is mostly to the downside.
This is not a forecast. It is a statement about what the index has already promised to deliver, and the gap between that promise and what the underlying economy can produce.
I. The setup
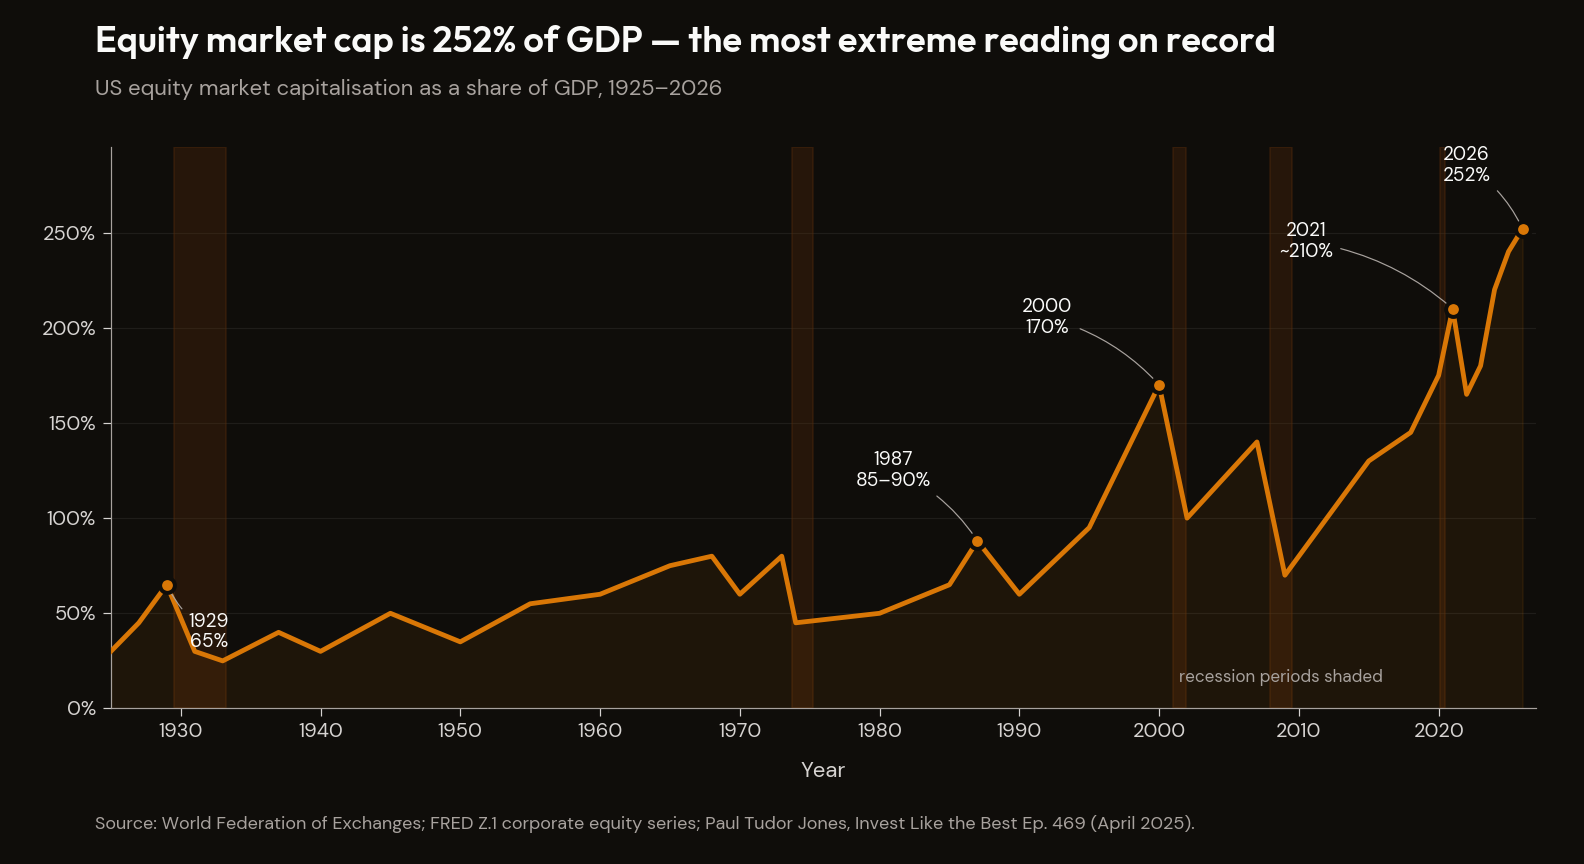
By the spring of 2026, the S&P 500 was trading just below its all-time high of 7,429 on a Shiller cyclically-adjusted P/E ratio of 42 — within a few points of the December 1999 peak of 44. Paul Tudor Jones placed the US market-capitalisation-to-GDP ratio at 252% in his April 2025 Invest Like the Best appearance;1 on the published Buffett-indicator series, the ratio sat at 230% at the end of 2025 (US$72 trillion of market cap against US$31 trillion of GDP) and has risen further as the S&P has compounded roughly a quarter year-on-year.2 On the cap-to-GDP metric, this is the most extreme reading in the postwar series.
The narrative inside the index is that AI is justifying it. The narrative outside the index — in the popular financial press, in Federal Reserve communications, in the bulk of sell-side equity commentary — is that valuations are stretched but not extreme, that the consumer is resilient, that earnings are strong, and that the multi-decade post-2008 bull market has, on balance, more legs.
Strip the framing. Here is what the aggregate measures actually say. The Shiller CAPE is at its second-highest reading in 144 years of data. Only the December 1999 peak (~44) has exceeded the current 42; the November 2021 reading of ~38.6 was lower and was sustained by zero rates that no longer exist. The current 42 is being held at four to five percent on the long bond, not zero. Cap/GDP is the highest in the available series, by a wide margin. The S&P 500 forecast 2027 operating margin, the load-bearing assumption underwriting forward earnings projections, is 21.4% — the highest figure in the modern series, against a fifty-year average closer to 11%. Margin debt is at an all-time high in absolute terms and elevated as a share of GDP. Household equity allocation as a share of total household financial assets is at an all-time high.
These are not five different signals. They are five different vantage points onto the same configuration: the price at which the aggregate index changes hands has, on every measure that has historically had any explanatory power for forward returns, run materially ahead of what the underlying corporate cash-flow base has been able to support over multi-year horizons.
The reflexive bull rebuttal at this point in the argument is there is no alternative — TINA. It was respectable through 2020–2021 at zero rates and it is no longer. The ten-year Treasury at 4.4% offers a positive real yield of approximately 1.7%. The S&P 500's earnings yield is approximately 4.3% — a roughly equal nominal yield to the risk-free rate, with the equity yield carrying the additional risk of multiple compression and earnings disappointment. The equity risk premium has compressed to its lowest level in twenty years. There are alternatives now; the TINA framing did not survive the rate cycle.
A reasonable reader can disagree about which measure matters most. A reasonable reader cannot disagree that all of them are at extremes. The question this essay is concerned with is what historically happens next, and why the typical reasons offered for why "this time is different" do not, on inspection, hold.
II. The three most reliable measures
The starting point for any honest discussion of equity valuation is the recognition that most of the metrics quoted in the financial press are, on their own historical track record, useless as forecasters of forward returns. Forward price-to-earnings on next-twelve-months estimates correlates poorly with subsequent ten-year returns, because the denominator is an analyst forecast that gets revised aggressively in both directions. Trailing twelve-month P/E correlates somewhat better but is dominated by short-cycle earnings noise. Dividend yield has lost its informational content as buyback activity has displaced dividend payment as the marginal mechanism for returning cash to shareholders.
The measures that have historically had the strongest correlation with subsequent ten-year real returns on the S&P 500, in order of empirical track record, are: market-capitalisation-to-gross-value-added (the MarketCap/GVA ratio John Hussman constructed and has published monthly since 2014); cap/GDP, the Warren Buffett indicator; and the Shiller cyclically-adjusted price-to-earnings ratio. Each of them, in different ways, controls for the noise in the earnings number by referencing the equity market's price against an aggregate that does not itself fluctuate with the cycle.
All three are, in the spring of 2026, at or above their respective 2000 peaks.
The cap/GDP indicator
Begin with the simplest. The total market capitalisation of US listed equities, divided by gross domestic product. The ratio is crude — it does not adjust for foreign earnings, for share repurchases, for sectoral mix. It is, despite all of that, one of the better-correlated single statistics with subsequent ten-year forward returns, which is why Buffett's 2001 Fortune essay famously called it "probably the best single measure of where valuations stand at any given moment."
Paul Tudor Jones, on the Invest Like the Best podcast (Episode 469, April 2025), gave the historical comparison in one sentence:1
"The number you need to know: US stock market cap is currently 252% of GDP. 1929 was 65%, 1987 was 85 to 90%, 2000 was 170, now it is 252."
| Year | Cap/GDP | What it preceded |
|---|---|---|
| 1929 | 65% | 1929 crash; 1929–1954 nominal recovery in DJIA |
| 1987 | 85–90% | Black Monday; 1987–89 recovery within ~24 months |
| 2000 | 170% | 2000–02 S&P −49%; Nasdaq −78%; 13-year real recovery |
| 2007 | 110% | 2008 −57% peak-to-trough; 2013 nominal recovery |
| 2021 | ~210% | Subsequent 25% drawdown 2022; recovery 2023–25 |
| 2026 | 252% | (the configuration this manuscript describes) |
The 2000 dot-com peak — the prior all-time-record extreme in modern US equity valuation — printed at 170% of GDP. The current reading is 252%, roughly fifty percent above the level that defined the most expensive equity market in modern American history. That sequence began at 170% cap/GDP. The aggregate index today is being purchased at 252%.
The standard objection is that GDP is a bad denominator because it does not capture US equities' growing exposure to foreign earnings. The S&P 500's foreign revenue share has been roughly 40% for two decades; the change since 2000 is too small to account for the 80-percentage-point widening of the cap/GDP gap. Hussman's MarketCap/GVA ratio — which addresses this critique directly — produces a similar conclusion.
The Shiller CAPE — confirmation
Robert Shiller's CAPE is at 42 in the spring of 2026, against a long-term mean of approximately 17. The reading has only been higher once in 144 years of data — the December 1999 peak of 44.19 — and CAPE has crossed 40 on only two occasions over the same span: that 1999–2000 window, and the present. The first occasion ended in the dot-com unwind. The S&P 500 fell 49%, the Nasdaq fell 78%, and US equities took thirteen years to make a fresh nominal high. The November 2021 reading of 38.6 was sustained at zero rates; the current 42 is held at a 4.4% ten-year and a 4.25–4.5% funds rate — the discount rate has approximately tripled while the multiple has continued higher. Starting CAPE explains the bulk of the variation in subsequent ten-year real returns on US equities. At 42, the historical regression line implies a subsequent ten-year real return between approximately minus three and zero percent annualised.
Hussman's MarketCap/GVA — confirmation
John Hussman's MarketCap/GVA ratio is the third measure and the most analytically rigorous. It divides the total market capitalisation of non-financial corporations by their gross value added. The correlation coefficient with subsequent twelve-year S&P 500 total returns runs between 0.90 and 0.94. The current reading is the highest in the historical series, exceeding both the late 2021 and 2000 peaks. Hussman's own characterisation, in his October 2025 monthly comment An Unsustainable Equilibrium: "The S&P 500 stands at the most extreme level of valuations in history."3 The subsequent twelve-year nominal total return implied from these levels runs in the negative low-single-digits annualised.
| Measure | 2026 reading | Long-term mean | All-time peak prior to 2026 | Implied 10–12y forward real return |
|---|---|---|---|---|
| Cap/GDP (Tudor Jones) | 252% | ~85% | 170% (2000) | Negative single digits |
| Shiller CAPE | 42 | ~17 | 44 (1999) / 38.6 (2021) | −3% to 0% annualised |
| Hussman MarketCap/GVA | All-time high | ~1.0 | 2021 (slight); 2000 (lower) | Negative low single digits |
The standard rebuttal is that valuations have been elevated by these measures for years and the index has continued to make new highs. The aggregate measures have never been useful as one-year or two-year market-timing signals; their statistical power is in the seven-to-twelve-year window. The argument that "the same measures said the same thing in 2017 and they were wrong" is misframed. The measures said in 2017 that the subsequent decade would be poor; we are now eight years into that decade, and the bulk of the cumulative return has come from multiple expansion rather than earnings growth — meaning the starting valuation has gotten worse, and the unhonoured forward-return obligation has gotten larger. The reckoning has been postponed, not refuted.
The rate version of the same rebuttal is low rates justify the multiple. The version was respectable in 2020–2021 at zero rates and does not survive the current rate environment. The ten-year Treasury yields 4.4%; the federal funds rate sits at 4.25–4.5%. The discount rate has approximately tripled while CAPE has retraced only modestly. A standard DCF with current rates produces a fair-value CAPE in the high teens to low twenties — roughly half the current reading. The argument now reverses direction: the rates we have justify a substantially lower multiple than the one we have.
III. The margin identity
The aggregate valuation measures above are stretched. The standard equity-market response to that observation is that aggregate valuations look stretched only if one assumes mean-reverting profit margins, and current profit margins are not mean-reverting because the structural composition of the S&P 500 — more software, more intellectual property, more global pricing power — has permanently raised the equilibrium margin level. On that interpretation, current valuations are not stretched at all, because they are being priced against permanently-higher earnings, which is exactly what record-high margins permit.
This is the single most important argument the bull case rests on, and it is also the argument with the weakest analytical foundation. Profit margins are not, primarily, a function of corporate-sector productivity or pricing power. They are an accounting identity — and the part of the analytical case that is structurally inconvenient for the bull case is also the part that gets cited least often in mainstream commentary.3
In any closed economy, the total income produced in a period must equal the total expenditure on that production. When this identity is partitioned by sector — corporate, household, government, foreign — it produces a set of constraints linking the financial balance of each sector. In particular, profits in the corporate sector, on a national-accounts basis, are mathematically equal to the sum of corporate investment, the household sector's dis-saving (when households dis-save, they spend more than they earn, and the difference flows to the corporate sector as revenue), the government sector's deficit (when the government runs a deficit, it spends more than it taxes, and the net transfer flows through the economy and arrives, on the other side of the ledger, as corporate-sector profit), and the foreign sector's deficit with the home economy (the trade deficit).
This identity is not theory. It is accounting. It must hold in every period, by construction, the way debits must equal credits in any double-entry book.
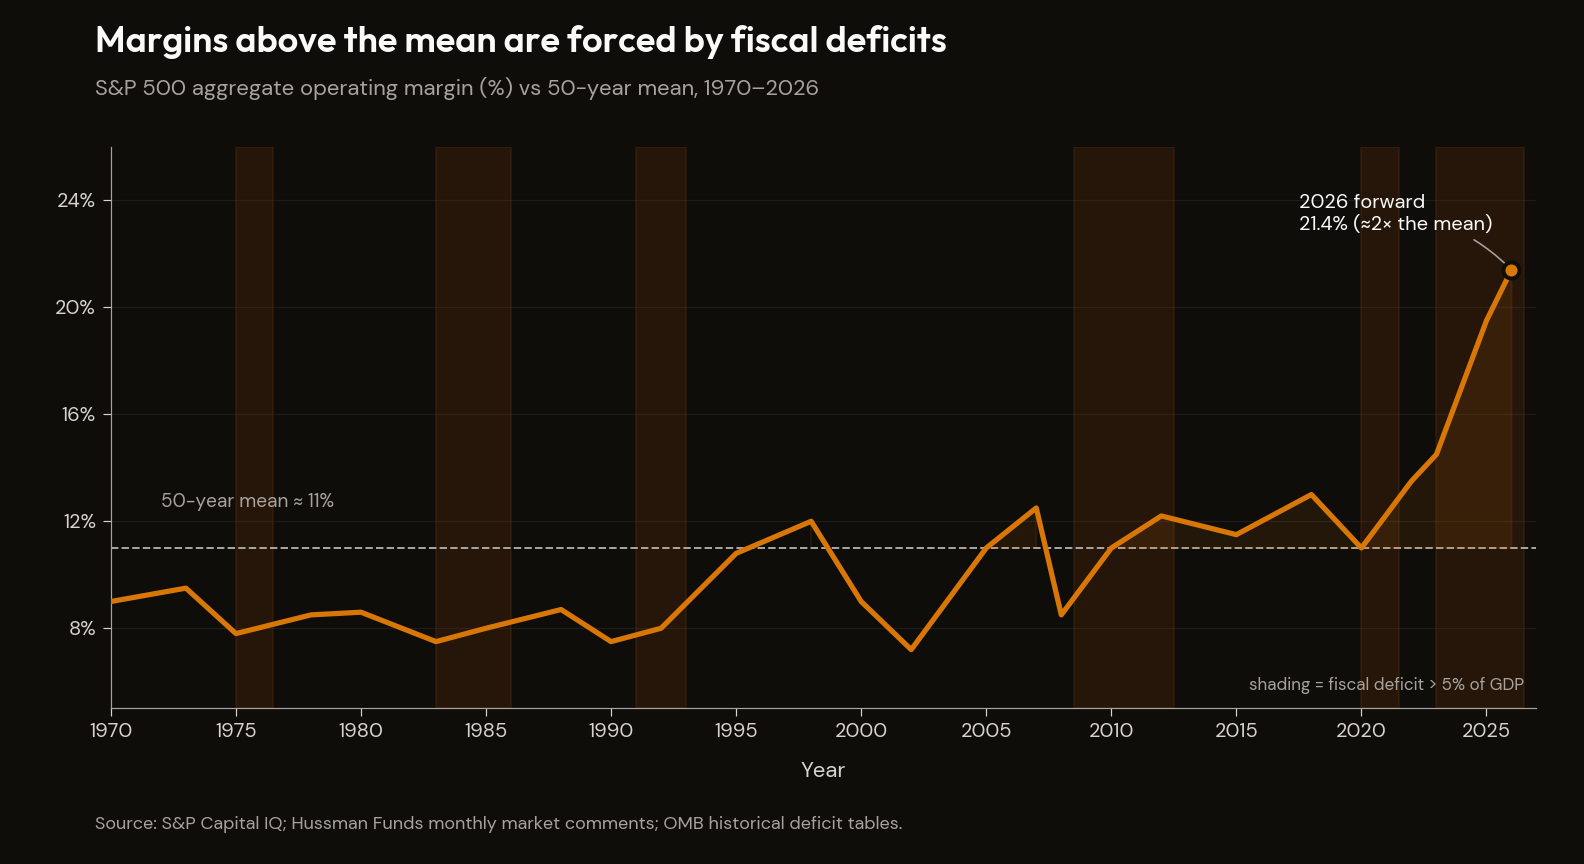
The implication is that record-high US corporate profit margins are not, as the bull narrative holds, evidence of permanent corporate productivity gains. They are the mirror image, on the corporate side of the ledger, of the record fiscal deficit and the record-low household savings rate. Corporate margins have been bid up to record levels by the largest sustained government deficit in peacetime US history (running at approximately 2 trillion dollars per year, against the backdrop set out in The Math Doesn't Work) and the lowest household savings rate since the immediate pre-GFC era (3.6% in March 2026, against a 2010s decade average of 6–8%). Both flows are running through the income identity and arriving on the corporate side as profit.
Now read the constraint in the other direction. If the fiscal regime described in The Math Doesn't Work eventually has to compress — because sovereign debt service cannot indefinitely absorb a quarter of federal tax revenue, because the maturity wall forces refinancing into higher coupons, because the bond market eventually disciplines the issuance schedule — then the corporate margin that mirrors that fiscal flow must compress in lockstep. And if the household savings rate rises off its multi-decade low (because households have exhausted the post-COVID buffer, because credit-card delinquencies are at fourteen-year highs,4 because subprime auto defaults are at thirty-year series highs,5 because the labour-market dynamics described in The AI Reckoning are compressing wages at the mobility margin), then the corporate margin that mirrors household dis-saving must compress as well.
The S&P 500 forecast 2027 operating margin is 21.4%. The fifty-year average is closer to 11%. The current forecast assumes that a margin level which has, in the historical data, only ever been achieved at the moments of maximum government deficit and maximum household dis-saving will be maintained indefinitely, at the same time the conditions producing it are exhausting their underlying structural support.
This is the load-bearing inconsistency in the aggregate equity market's current pricing. The earnings forecasts that justify the multiples that justify the aggregate cap/GDP and CAPE readings are themselves underwritten by an accounting identity whose components are, in The Math Doesn't Work's framework, structurally unsustainable. Either the fiscal arithmetic is wrong — in which case there is no problem — or the corporate margin component of S&P forward earnings has to compress mechanically as the fiscal flow compresses. There is no third option. The accounting identity does not allow one.
Profit margins are quasi-mean-reverting because they are a downstream effect of macroeconomic flows that themselves cycle, and the mean-reversion arrives, every cycle, with a rapidity and severity that the equity market consistently fails to anticipate. The question is not whether margins will normalise. The question is over what timeframe.
There is one further complication that The Demographic Crunch develops in detail on labour-supply dynamics, and that is worth flagging here. The post-1980 era of secular margin expansion was underwritten in significant part by the entry of two billion workers (China, India, the former Soviet bloc, the developing-world demographic dividend) into the integrated global labour market over a thirty-year window. That supply-side expansion compressed the wage share of national income across every developed economy. Since approximately 2015, the same dynamic has begun to reverse: working-age populations in China, much of Europe, and Japan are now declining in absolute terms, the US working-age population is growing only because of immigration, and the political backlash against immigration in the developed world is compressing that residual flow as well. The aggregate global labour supply that underwrote the margin expansion of the 1990s, 2000s, and 2010s is no longer expanding. The structural tailwind is reversing.
Margins expanded for forty years against a labour-supply tailwind that is now turning into a headwind, and against a fiscal-and-household flow that has produced the largest sustained corporate-sector subsidy in modern macroeconomic history. The current 21% forecast operating margin is the asymptote of those two flows running flat-out. When either reverses — and the demographic one already has — the margin compresses with them.
The earnings number that the multiple is being applied to is, in other words, structurally fragile in a way that the aggregate equity market's price has not been forced to acknowledge.
IV. The Marks math
The cleanest single statement of what current starting valuations imply for forward returns comes from Marks's August 2025 Calculus of Value memo.6 The framework is the simpler exercise — looking back over the period for which forward-looking P/E ratios and resulting ten-year returns are both available, and observing what the empirical relationship has been.
The conclusion, verbatim:
"If you bought the S&P 500 index at 23 times the coming year's earnings per share in the period 1987–2014 (the only period for which there's data on forward-looking p/e ratios and resulting ten-year returns), your average annual return over the subsequent ten years was between plus 2% and minus 2% every time."
This sentence repays slow reading. The S&P 500's forward P/E in the spring of 2026 sits above Marks's 23× threshold. In the historical sample, every single ten-year window that began with a starting forward P/E at or above 23× produced an average annualised nominal return between plus two percent and minus two percent — not on average, every time.
The implication is not that the S&P 500 will fall by some specific amount in some specific period. The implication is that an investor purchasing the aggregate index at the current starting multiple should expect, on the historical base rate, a nominal annualised return over the subsequent decade somewhere between plus two and minus two percent. Net of inflation — running at approximately 2.7% per the March 2026 CPI print7 — that is a real return of approximately negative one to negative five percent annualised, compounded over a decade. A 10% to 40% real-terms loss of purchasing power on a ten-year horizon, before any consideration of further multiple compression or earnings disappointment.
Marks's own restraint about the implication is characteristic: "today's high p/e ratio is unlikely to be associated with above-average returns over the next ten years." Not crash. Not bubble. The math, on the historical base rate, does not produce above-average returns from here.
Oaktree expressed the implication through its actions rather than its rhetoric. In Q2 2025, the firm increased SPY put exposure by 200%, to $388 million notional — by quarter-end the second-largest disclosed position in the reportable portfolio. The position is not a bet that the index will collapse on a calendar date. It is the carrying cost of insurance on the asymmetric forward-return distribution the historical data suggests current valuations have produced. The bull case for the S&P 500 over the next decade is not, on examination, a claim that the index will compound at the historical 9–10% nominal annualised rate. It is a claim that the index will compound at the historical rate from a starting valuation at which the historical rate has never been delivered. There is no period in the available data in which buying the S&P 500 at a starting valuation as rich as today's produced anything close to its long-run average return over the subsequent ten years. The bull case requires not merely that the future resembles the past, but that it improves on every historical precedent. That is a much stronger claim than the bull case is typically willing to admit it is making.
The framing also clarifies what being defensive in 2026 is and is not. Defensive is not a permabear position. It is not a forecast that the index will crash in the next quarter. It is a recognition that buying the index at current valuations has, in the historical data, produced asymmetrically poor forward returns, with downside outcomes substantially exceeding upside outcomes in magnitude and frequency. The contrarian's job in a market like this one is not to predict the unwind but to recognise that the consensus has priced an unrealistically optimistic forward path and to position for the asymmetry that creates. Being defensive at 23× forward P/E is not a market call. It is a recognition that the market has already made a call, and the call is wrong on the historical base rate.
V. The Mechanical Bid
The Marks math is essentially the same math that has been true since 2017, and the bearish forward-return signal those measures gave then has persisted, with worsening starting valuations, every year since. The index has continued to make new highs. Anyone who acted on those signals has, on every measurable horizon shorter than a decade, lost money relative to a passive position in the index they were warning against. The bear-case math has been right and the bear-case timing has been wrong, and the explanation for the divergence is structural rather than analytical. The mechanism by which valuations have stayed elevated against fundamentals — the mechanism the conventional valuation framework does not engage — is the rise of price-insensitive, mechanical, mandated buying through the passive-index complex. Mike Green has been articulating this thesis since 2018; his framework is the missing mechanism the conventional valuation work leaves implicit.
Passive investors are not passive in any economic sense. They are the world's largest buying algorithm, executing on a single rule: when cash flows in through 401(k) payroll deductions, IRA contributions, or target-date-fund glide paths, buy in proportion to current market capitalisation; when cash flows out, sell in proportion. Green's plain-language summary, from the January 2025 Institutional Investor profile:
"Did you give me cash? If so, then buy. Did you ask for cash? If so, then sell. That's it. That's the secret of passive."
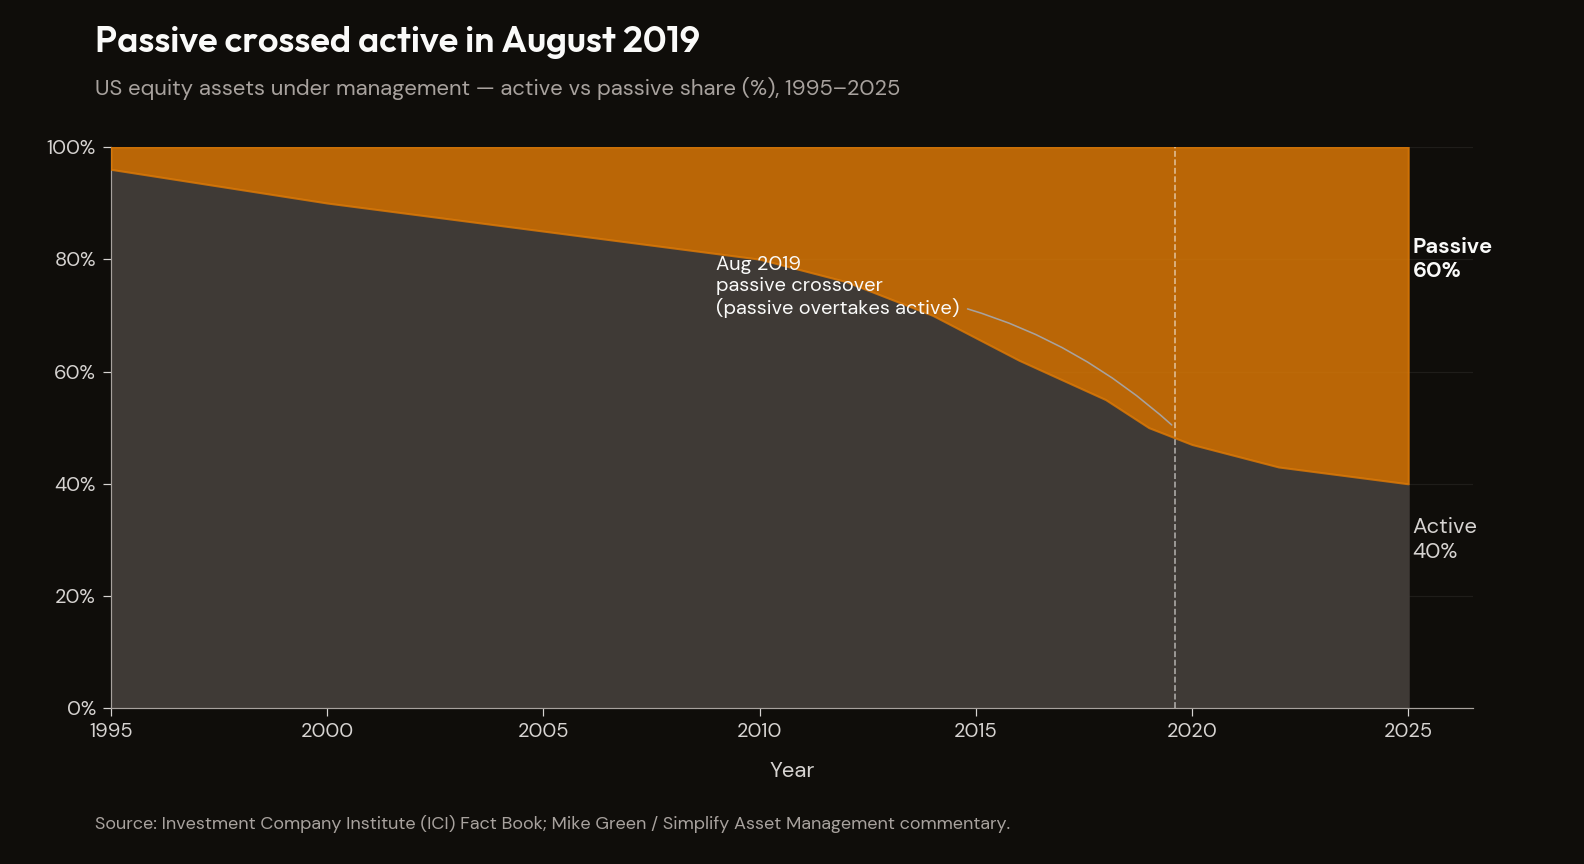
The market participant the efficient-market framework assumes — the informed price-setter who buys when price falls below fair value and sells when it rises above — has been substantially displaced. Active managers represented approximately 80% of US equity trading in 1995; they represent approximately 10% today. The marginal price-setter in the aggregate index, in 2026, is a mechanical algorithm with no opinion about value.
The configuration is reflexive in a way that distinguishes it from earlier valuation regimes. Passive strategies buy in proportion to market capitalisation, which means they buy more of whatever has gone up since the last purchase — reinforcing the momentum characteristics of the market, and as passive becomes a larger share, driving increased concentration and correlation. The mechanism is structurally distinct from normal market momentum. It does not require investor enthusiasm or behavioural error. It runs on payroll auto-enrollment and target-date-fund glide paths.
The empirical scale clarifies the argument. Passive funds crossed 50% of all US equity fund AUM in August 2019 — the passive crossover — and have continued to gain share since. Approximately $10 trillion of US equity capital is now benchmarked or directly indexed to the S&P 500 alone. The Big Three — BlackRock, Vanguard, State Street — collectively manage over $30 trillion, are the largest single shareholder in 88% of S&P 500 companies, and cast approximately 25% of all votes at shareholder meetings. Total US retirement assets reached $44.1 trillion at end-2024; target-date fund assets crossed $5 trillion in 2025. The flows that determine where the marginal dollar of US equity ownership sits are, in 2026, predominantly mechanical. GMO's Q2 2024 quarterly letter put the extreme version sharply: passive target-date funds wholly disregard fluctuations in real bond yields and equity valuation ratios — an investor in such a fund would have had the same equity allocation in March 2009 as in March 2024, despite the equity risk premium differing radically across the two periods.
Cliff Asness has written the most thorough rebuttal in his September 2024 Less-Efficient Market Hypothesis: he concedes that "the rise of indexing has made stock prices more inelastic," but argues the magnitude is uncertain and probably modest relative to social-media-driven speculation.8 GMO takes a parallel position: passive flows help explain elevated aggregate valuations but explain less of the mega-cap concentration within the index, which they attribute primarily to fundamental earnings concentration. The honest synthesis is that flows amplify and extend valuation regimes; they do not create them from nothing. The Mag 7's earnings are real and have outperformed the broader index for substantively fundamental reasons. But the multiple applied to those earnings, and the concentration the index now displays, are amplified by a mechanical buying regime that does not adjust for valuation and cannot adjust for fundamentals it has no opinion about.
The academic literature has begun to formalise the argument. Gabaix and Koijen's 2021 inelastic-markets hypothesis estimates that every $1 of institutional flow into US equities increases aggregate market value by approximately $5.9 Haddad, Huebner, and Loualiche (AER 2025) found markets have become roughly 11% more inelastic specifically as a result of the shift to passive. Jiang, Vayanos, and Zheng showed that passive inflows disproportionately benefit the largest index constituents, mechanically inflating concentration above what fundamental concentration would produce.10 Burry made the analogy in plain language in 2019: this is the synthetic-CDO mechanism again — price-setting driven not by fundamental security-level analysis but by massive capital flows responding to Nobel-approved models of risk that proved to be untrue.
The mechanism resolves the puzzle this section opened with. The Marks math has been right; the timing has appeared wrong because the marginal price-setter the math assumes — an informed investor responding to forward-return implications — has been substantially displaced by an algorithm that does not respond to forward-return implications at all. The mechanism also clarifies what happens when the flows reverse: when withdrawals eventually exceed contributions, the inelasticity that inflated valuations on the way up accelerates the correction on the way down, because passive funds hold no cash buffer and sell indiscriminately into whatever bid exists. The buyers who would normally step in at lower valuations have, by the framework's own argument, been substantially purged from the market in the prior cycle.
Whether net flows turn negative — and on what timeframe — is the empirical question The Demographic Crunch engages directly. That essay takes up the macro mechanism: the cohort that built the passive bid through forty years of payroll-deducted accumulation is now in retirement-age decumulation, with required minimum distributions providing a forced-selling lower bound regardless of behavioural choice. The mechanism that has supported the bull market on the way up is mechanically symmetric, and the demographic curve that built it is now turning.
This is one expression of a recurring pattern across the manuscript. The flows that drive equity valuations are now mechanical (passive auto-enrollment). The flows that drive Treasury demand are increasingly mechanical (stablecoin issuer reserves under the GENIUS Act, as developed in The Math Doesn't Work).11 The flows that drive private credit are increasingly mechanical (insurance balance sheet conversion of corporate pensions to annuities). In each case, the marginal price-setter is no longer the informed value investor the efficient-market framework assumes — it is an algorithm or a regulatory mandate. Mechanical, not informed. The system is breaking not because no one is choosing the prices, but because the choosing has been substantially mechanised, and the mechanism has no internal stop on inflation.
VI. The counter-arguments
The TINA and low-rates rebuttals were engaged in §I and §II respectively, where the rate-environment evidence is contemporaneous with the valuation evidence rather than warehoused at the back of the essay. Two harder counters remain.
"This time is different — the structural composition of the S&P has shifted toward higher-quality businesses that warrant higher multiples." The most-cited bull argument: correct directionally and overstated quantitatively. The current CAPE is approximately 2.3 times its long-term average; sectoral-mix adjustments, on the most generous interpretation, account for 20–30% of the gap. The remaining 70–80% is real. The higher-margin businesses that supposedly justify the multiple are also more concentrated than at any prior peak — the top ten names now account for over 40% of index market capitalisation. The structural-composition argument, followed honestly, leads directly into the concentration problem that The AI Reckoning takes up.
"Earnings growth will bail out the multiple." The most analytically serious bull argument. The S&P 500's long-run nominal EPS growth rate, in the post-WWII data, is 6–7%. To rescue the current multiple via earnings growth alone, EPS would need to compound at approximately 12–15% per year for half a decade — roughly double the historical norm — at the same time that the margin component of those earnings is, by the accounting identity argument in §III, structurally vulnerable. Even if the rescue is achieved, the implied scenario is that the index produces a flat nominal price for half a decade while earnings catch up — mathematically equivalent, for an investor purchasing the index today, to half a decade of zero return. The argument, when carried through, is itself the bearish case in different clothing.
What none of these counters engages is the structural condition of the underlying economy that has to deliver the corporate cash flows. The bull case is everywhere a story about the multiple. The bear case is a story about the cash flows, and the cash flows are not in a configuration to support what the multiple has already promised.
VII. The trigger question
A natural objection, raised whenever an analytical bear case is laid out at length, is that the analysis lacks a catalyst. In the absence of a trigger — a recession, a credit event, a geopolitical shock, a Fed policy mistake — the gap between price and underlying cash flow can persist indefinitely.
The answer has two parts.
The first is that the gap does not require a discrete trigger to close. It can close through the simple arithmetic of time. If the S&P 500 sits flat in nominal terms for five years while underlying earnings compound at the historical 6–7%, the forward P/E compresses from 23× to roughly 16× — approximately the long-run average. The investor earns the dividend yield (~1.3%) and nothing else; net of inflation, the investor loses roughly 7% in real terms over five years. No crash, no recession — just the slow grinding closure of the valuation gap. The 1966–1982 secular bear market was sixteen years of nominal sideways action compressing the multiple by inflation grinding underneath a flat price. The 2000–2013 period delivered a similar dynamic.
The second part is more uncomfortable. The triggers are queued up — the maturity wall, the OASI trust-fund depletion, the hyperscaler AI capex cycle (which Scott Galloway in May 2026 framed bluntly: "the majority of GDP growth over the last two years has come from AI capex. If that slows down, we're immediately in recession."), and the rising private-credit default rate at 5.8% TTM (Fitch, January 2026).12 13 The Master Table in The Math Doesn't Work carries the full inventory.
Any one of these triggers could close the valuation gap discretely rather than slowly. None of them is required. The gap closes either way. The question is only over what timeframe.
What is genuinely unknown is the timing. The path of the unwind — whether a sharp 30–40% drawdown over twelve months or a 16-year nominal sideways grind — is unknown. What is not unknown is the starting condition: the highest aggregate equity valuation on three independent measures in modern US market history, against a fiscal regime that mathematically cannot deliver the corporate cash flows required to support the current price.
The math does not tell you the year. The math tells you the regime.
VIII. The Mirage and the Math
The aggregate equity market is the level at which the bear case is most diffuse and most contested. It is also the level at which the structural arithmetic is hardest to escape.
The aggregate cap/GDP and CAPE readings are not produced by a uniform stretch across the entire index. They are produced disproportionately by the seven largest names, which account for roughly 31% of S&P 500 market capitalisation; the top ten exceed 40%. The aggregate problem is therefore, mechanically, a Mag 7 problem. The Mag 7's revenue base is roughly two-thirds consumer-driven on a look-through basis, and that consumer cohort is, as developed in The AI Reckoning, experiencing wage compression historically only seen in deep recessions — with the underlying mechanism being the substitution of AI for the cognitive labour that produces top-quintile income. The Mag 7 is being valued as if it can compound earnings at rates the post-WWII S&P 500 has never sustained, on the back of a consumer base whose income pipeline its own AI products are severing.
The mirage is the implicit promise embedded in current prices — that aggregate corporate earnings will compound, against a fiscal regime that cannot subsidise the margins, against a household sector that cannot maintain the dis-saving, against a labour supply that is no longer expanding, at rates that have not historically been delivered from starting valuations even half this rich.
The aggregate measures are at the highest levels in modern US market history. The structural conditions that have to underwrite the implied forward returns are simultaneously at their weakest configuration in two generations. These two facts cannot both persist. Either the aggregate measures normalise, or the underlying structural conditions reverse in a way the post-2008 macro regime gives no reason to expect.
Being defensive at current valuations is not a permabear position. It is a recognition that the consensus has priced an unrealistically optimistic forward path and that the contrarian's job is to position for the asymmetry rather than predict the date.
The math is the math. The timing is the question. The regime, on the arithmetic, has already changed — the index price is the last variable to acknowledge it.
The aggregate index is now priced at a level the underlying economy has never had to support. The unwind does not require a recession to arrive.
Footnotes
-
Paul Tudor Jones, Invest Like the Best with Patrick O'Shaughnessy, Episode 469 — Spotify. The verbatim cap/GDP figures ("1929 was 65%, 1987 was 85 to 90%, 2000 was 170, now it is 252") occur at approximately 35:55. ↩ ↩2
-
CurrentMarketValuation.com — Buffett Indicator. End-2025 reading: 230% on US$72.14 trillion of total US market cap against US$31.33 trillion of annualised GDP. Multpl.com Shiller PE series (multpl.com/shiller-pe) for the CAPE reading of 42.08 as of May 12 2026. ↩
-
John P. Hussman, An Unsustainable Equilibrium, Hussman Funds Market Comment, October 27 2025 — hussmanfunds.com. Source of both the valuation-extremity quote and the accounting-identity passage cited in §III. ↩ ↩2
-
Howard Marks, The Calculus of Value, Oaktree Capital memo, August 2025 — oaktreecapital.com. ↩
-
Clifford Asness, The Less-Efficient Market Hypothesis, forthcoming in The Journal of Portfolio Management 50th Anniversary Issue, September 2024 — SSRN 4942046. ↩
-
Xavier Gabaix and Ralph S. J. Koijen, In Search of the Origins of Financial Fluctuations: The Inelastic Markets Hypothesis, NBER Working Paper 28967 (June 2021) — nber.org/papers/w28967. ↩
-
Hao Jiang, Dimitri Vayanos, and Lu Zheng, Passive Investing and the Rise of Mega-Firms, NBER Working Paper 28253 — nber.org/papers/w28253. ↩
-
Fitch Ratings — US Private Credit Default Rate Continues Upward March to 5.8% in January 2026 (February 2026). ↩