The Energy Bottleneck
In 60 seconds
AI capex assumes electricity is a software-speed input. Power infrastructure is built on 50–70 year cycles. NERC revised 10-year US peak demand up by 69%; PJM cleared at the FERC ceiling two years running; hyperscaler nuclear PPAs cover 1.8 GW of net-new capacity against 80–100 GW of self-created demand. The grid cannot deliver on the capex timeline; the binding constraint is thermodynamic, not capital.
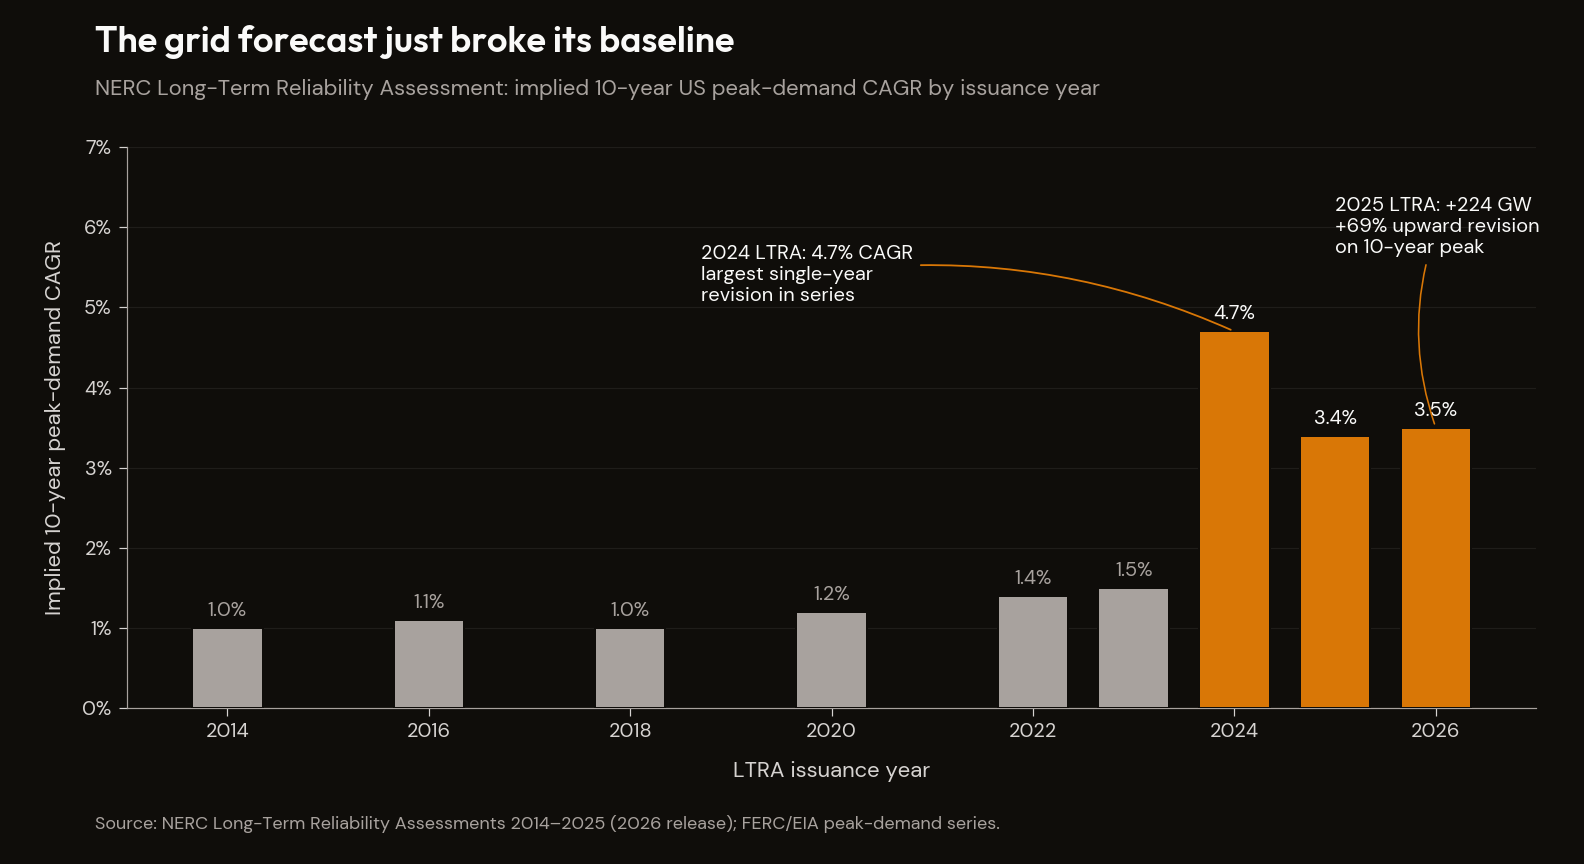
In January 2026, the North American Electric Reliability Corporation released its annual Long-Term Reliability Assessment, the document the US grid operators use to plan capacity. The headline number was that summer peak demand in the United States is now projected to grow by 224 gigawatts over the next ten years — a 69% upward revision in a single year against the 2024 baseline. It is the largest single-year revision in the assessment's history.1 NERC's own framing was unambiguous: "Projected resource additions do not keep pace with escalating demand forecasts and announced generator retirements." The assessment placed MISO and PJM in the elevated-risk category beginning 2026–2028, escalating to high-risk in 2028–2029.
NERC is the federally designated reliability authority for the bulk power system; its job is to be conservative, because when its forecasts are wrong on the low side, the lights go out. It adjusted the country's ten-year peak-demand outlook upward by more than two-thirds in a single annual cycle, principally on account of hyperscaler data centres being built to train and serve artificial intelligence.
The AI Reckoning described the AI hyperscaler thesis as an arithmetic problem. This essay describes it as a physics problem. The AI capex thesis assumes that electrical power is something like a software input — abundant, low marginal cost, scaleable on the same timeline as the chips. It is not. Power is a physical input built out on a 50-to-70-year cycle. The collision between a 5-to-10-year capital cycle and a 50-to-70-year infrastructure cycle is not a problem to be solved in 2030. It is binding now. The NERC revision is the demand-side signature; the PJM capacity auction clearing at the FERC price ceiling for two consecutive years is the price-side signature.2 The hyperscalers' response — a flurry of nuclear PPAs announced through 2024 and 2025 — covers, on the most generous arithmetic, less than 2% of the demand they themselves are generating.
I. The Demand Shock
The NERC 2025 Long-Term Reliability Assessment is the right place to start, because it is the conservative source. NERC does not extrapolate. It aggregates utility forecasts and overlays its own reliability stress tests; if anything, the regional transmission organisations have a structural incentive to underforecast load growth, because overforecasting commits them to capacity-expansion plans that draw regulatory scrutiny.
Against that reporting bias, the 2025 LTRA still produced a +224 GW upward revision to the ten-year summer peak forecast — moving the baseline from roughly 132 GW of cumulative growth to 356 GW. Winter peak revisions tracked a similar shape: +245 GW, a 65% increase. NERC's own narrative attributed roughly 70% of the revision to large industrial loads, the catch-all category that, in 2025, means data centres. The same document warned that large industrial loads alone could add up to 300 GW of new demand between 2028 and 2030.
For a sense of scale: the entire installed generating capacity of the United Kingdom is roughly 80 GW. NERC is saying that the US grid needs to absorb something on the order of three or four UKs' worth of incremental peak demand within five years — and that almost all of it is concentrated in a handful of regions where data-centre development is densest, principally PJM (the mid-Atlantic and parts of the Midwest), ERCOT (Texas), and MISO. PJM alone now expects summer peak demand to rise by 56 GW to 210 GW by 2035.1
The corroborating sources are converging on the same picture from different methodologies. The Energy Information Administration's Annual Energy Outlook 2026, released in April, projects that data centres and electric vehicles together will account for 50% to 80% of all incremental US electricity demand growth through 2050, with data centres alone reaching 818 billion kWh of annual server electricity use in the high-demand case — roughly sixteen times the 2020 figure.3 The EIA is generally regarded as the most conservative of the major energy forecasters; its prior AEOs systematically underestimated technology-driven load growth. That this forecast is the conservative case matters.
The Electric Power Research Institute, working bottom-up from utility interconnection requests, projects that data centres will consume 9% to 17% of all US electricity by 2030, against a 2024 baseline of roughly 4%. The 2025 revision is approximately 60% higher than EPRI's previous estimate, and the methodology is the most robust of the major studies — it counts what utilities are actually being asked to connect, rather than projecting trend growth.4
The International Energy Agency's Electricity 2025 report adds the global frame: data-centre electricity consumption rose roughly 17% in 2025; AI-specific data-centre consumption rose approximately 50%. The buildings sector, dominated in incremental terms by data centres, accounted for roughly 80% of US power-demand growth in 2025. The US share of global incremental electricity demand growth in 2025 was approximately 50% — almost entirely data centres.5
NERC, EIA, EPRI, and the IEA use different methodologies and serve different constituencies; none coordinates with the others. The lowest-case "consensus" forecast in 2026 now exceeds what was the bull case eighteen months earlier — the underlying datum being recognised, with delay, by every analyst capable of measuring it.
The forecast that called it earliest was the insider one. Leopold Aschenbrenner's June 2024 essay Situational Awareness — written by an ex-OpenAI Superalignment researcher who has since founded a multi-billion-dollar fund built on the same thesis — projected that data-centre electricity demand would reach approximately 5% of US production by 2026, 20% by 2028, and 100% by 2030, with individual training clusters by end of decade requiring power "equivalent to >20% of US electricity production." The first of those three numbers has materialised on his calendar. The second is what NERC's January 2026 LTRA is now describing. Aschenbrenner's central claim was unambiguous: "probably the single biggest constraint on the supply-side will be power."6 The remainder of this essay tests whether the supply side can deliver against the demand his framework, and now NERC's, projects.
A cross-essay note. The Mag 7's revenue depends on the consumer; the AI capex underwriting Mag 7 valuations depends on hyperscaler spend; the hyperscaler spend depends on the data centres being powered. Section I establishes that the demand for that power has been revised up by an order-of-magnitude factor. The rest of the essay asks whether supply can follow on the timeline the AI capex cycle requires. It cannot.
II. The Build Reality
Aschenbrenner described the supply inversion a year before NERC's revision arrived. "Willingness-to-spend doesn't even seem to be the binding constraint at the moment, at least for training clusters," he wrote in June 2024. "It's finding the infrastructure itself: 'Where do I find 10GW?' is a favorite topic of conversation in SF."6 Capital is no longer the binding input; infrastructure is. The CFOs of the four hyperscalers have, since mid-2025, replaced the language of capital allocation with the language of grid procurement. Microsoft's CFO has disclosed that approximately $80 billion of contracted Azure demand is currently blocked by power availability rather than capital availability.
Begin with what is required. To meet the revised demand outlook while maintaining historical reserve margins, the United States needs to add on the order of 30 to 40 gigawatts per year of new dispatchable generation through 2030 and beyond. "Dispatchable" is the technical term for capacity that can be called on at any time, regardless of weather or sunlight: principally natural gas, nuclear, hydro, and battery-firmed renewables. It excludes intermittent solar and wind unless those resources are paired with sufficient storage to deliver firm power on demand.
Then look at what is being built. Net new dispatchable capacity additions in 2024, calculated from FERC's interconnection-queue clearing data, ran at roughly 5 to 8 GW per year. Solar and wind are being added at a much higher rate — 30 to 40 GW per year — but those resources are not one-for-one substitutes for the dispatchable generation being retired, because a megawatt of nameplate solar capacity does not deliver a megawatt of power at 7 PM on a still summer evening when a data centre is drawing peak load. Coal retirements are scheduled to take a further 10 to 15 GW per year off the dispatchable side of the grid through 2030. The dispatchable shortfall is therefore not a simple gap; it is a gap that is widening as the grid simultaneously retires firm capacity and adds intermittent capacity.
The interconnection queue is the bureaucratic place where the build-out either happens or fails to happen. As of mid-2025, FERC reported approximately 2,600 GW of generation in interconnection queues nationally — more than twice the entire installed US generating capacity. That queue, if cleared, would solve the problem several times over. The historical clearing rate is the binding constraint: roughly 14% of queued projects ever reach commercial operation, and the average queue time is now five years, with some PJM projects sitting in the queue for seven or longer. The queue is full because everyone wants to build. The grid is short because almost no one finishes.
There is no shortage of project proposals. There is a shortage of completed grid connections. The distinction matters because it tells us where to look for the binding constraint. It is not capital allocation; it is permitting, transmission, supply chain, and skilled labour, in roughly that order. The lead time for a large power transformer — a single piece of equipment without which no new generating station can connect to the high-voltage grid — has extended from roughly six to nine months in 2015 to eighteen to twenty-four months in 2025. The transmission build-out is roughly twice as slow as generation, because every long-distance line crosses jurisdictional and political boundaries that have to be negotiated separately.
Now look at the price.
The PJM capacity auction is the largest electricity capacity market in the United States. Its function is to compensate generators for being available to deliver power during peak periods, separately from the energy market that pays them when they actually run. Capacity prices are the cleanest available read on whether the grid has enough firm capacity to meet projected demand: when capacity is abundant, prices fall; when it is scarce, prices rise.
In the 2024/25 auction, cleared in May 2024, PJM's capacity market settled at approximately $28.92 per megawatt-day — a normal, low-stress year. In the 2025/26 auction, cleared in May 2025, the rest-of-RTO price (excluding two locationally constrained zones) settled at $329.17 per megawatt-day — the FERC price cap, and approximately eleven times the previous year's clearing price. The Dominion zone settled even higher, at $466.35 per megawatt-day, also at its locational cap. In the 2026/27 auction, cleared in May 2026, the entire PJM RTO cleared at $329.17 per megawatt-day for a second consecutive year — the first time in the market's history that the entire footprint hit the FERC ceiling.2
| Auction year | Clearing price ($/MW-day) | Notes |
|---|---|---|
| 2022/23 | 50.00 | Pre-AI baseline |
| 2023/24 | 28.92 | Pre-AI baseline |
| 2024/25 | 269.92 | First AI-driven surge |
| 2025/26 | 329.17 | At FERC ceiling |
| 2026/27 | 329.17 | Second consecutive year at FERC ceiling |
A capacity auction that clears at the regulatory price cap two years running is making a specific statement: the market would pay more than this if the regulator allowed it to.
In a normal market, a price spike like this would be a temporary disequilibrium, with new capacity expected to enter and bring prices back down within a year or two. In PJM in 2025 and 2026, the spike persisted at the cap for two consecutive auctions, and the queue of new dispatchable capacity capable of clearing the next auction is empty enough that there is no plausible reason to expect 2027/28 to clear lower. This is the textbook empirical signature of a binding physical constraint.
There is a second-order problem in the same data. Even at $329.17 per megawatt-day, the economics of building a new combined-cycle gas plant are marginal: a 500 MW gas plant earns roughly 6% to 8% against a hurdle rate of 10% to 12%. The price signal is screaming and the supply response is muted, because the cap suppresses it and construction economics are damaged simultaneously. PJM's 2026/27 auction procured 134,311 MW of unforced capacity, below reliability-target requirements in some zones. The grid is short on dispatchable capacity for demand it must serve in two years.
III. The Hyperscaler Nuclear Math
The standard reply to everything in the previous two sections — and it is now the reply offered in nearly every hyperscaler earnings call from late 2024 onward — is that the hyperscalers are solving the constraint by procuring their own nuclear power. Microsoft has signed a 20-year power purchase agreement to restart Three Mile Island Unit 1;7 Amazon has expanded its arrangement with Talen Energy at the Susquehanna nuclear plant;8 Google has contracted with Kairos Power for SMRs;9 Meta announced 6.6 GW of nuclear commitments in January 2026 spanning Vistra's existing fleet, TerraPower's Natrium project, and Oklo.10 The narrative has settled into a comfortable shape: AI is forcing nuclear back, the hyperscalers are funding the renaissance, and the grid will follow.
The arithmetic of those announcements deserves a careful look.
The announced numbers: Microsoft's Three Mile Island restart is 835 MW, targeted for 2028. Amazon's Susquehanna deal totals up to 1,920 MW, ramping 2029–2032. Google's Kairos SMR agreement is 500 MW, targeted for 2035. Meta's January 2026 announcement covers 6.6 GW of aggregate commitment across Vistra, TerraPower, and Oklo. Brownfield restarts (Palisades, Duane Arnold) add roughly 1,500 MW. Cumulative hyperscaler nuclear procurement: 4.5 to 6.6 GW of announced commitments.
The number that matters is different: net new dispatchable nuclear capacity, by 2030, that would not otherwise exist on the grid. Three Mile Island counts (the reactor was decommissioned) — add 835 MW. Susquehanna is existing capacity; the Amazon deal is a long-term offtake, but the megawatts were already on the grid (perhaps 300–500 MW of net new ramp by 2030). Meta's Vistra agreement covers 2.1 GW of existing nuclear plants in PJM — reallocation, not new megawatts. TerraPower Natrium and Oklo do not deliver commercial megawatts before the 2030s. Kairos's full deployment targets 2035. Brownfield restarts add ~800 MW–1.5 GW of true net new by 2030. Add the actual net-new figures: total hyperscaler-driven new nuclear by 2030 lands at approximately 1.8 gigawatts.
| Source | Net-new MW by 2030 | Status | Notes |
|---|---|---|---|
| Three Mile Island Unit 1 restart (Constellation/MSFT) | ~835 | Existing reactor restart | Net-new = 0 system-wide |
| Vogtle 3/4 (existing build) | ~2,200 | Online but counts as existing capacity contracts | Reallocates rather than adds |
| Small modular reactor PPAs (multiple) | ~1,800 cumulative | Announced; in permitting | Net-new |
| Total hyperscaler-driven net-new nuclear by 2030 | ~1,800 | ||
| Hyperscaler demand growth requiring net-new | 80,000–100,000 | ||
| Coverage ratio | ~2% |
Against demand growth from the same hyperscalers — NERC-implied incremental load of 80 to 100 gigawatts over the same period — that net new nuclear figure covers approximately 2% of the demand the hyperscalers themselves are creating. The remaining 98% must come from somewhere else, on a faster timeline than nuclear can be built.
Vogtle Units 3 and 4 in Georgia are the only conventional large nuclear reactors completed in the United States in roughly thirty years. Original 2009 cost estimate: $14 billion. Final 2024 cost: approximately $36.8 billion — a 260% overrun. Time from groundbreaking to commercial operation: roughly fifteen years, against an original target of seven. The reactors work; they were also six years late and 2.5× over budget, built by a utility (Georgia Power) and vendor (Westinghouse) with decades of nuclear experience.
The SMR record is thinner. NuScale, the most-developed SMR vendor, cancelled its flagship Idaho project in November 2023 after costs escalated and customers withdrew. Kairos targets 2027 demonstration / 2030s commercial. Oklo is pre-commercial. X-energy targets 2030. TerraPower's Natrium plant targets the 2030s, contingent on federal co-funding and state approvals not yet final.
Mark Nelson of Radiant Energy Group, among the most pro-nuclear voices in the industry, frames it precisely: nuclear is necessary but not sufficient on AI's timeline. SMRs need five-plus years; new conventional reactors need ten to fourteen; brownfield restarts need two to four. Even maximally aggressive nuclear deployment closes less than 30% of the dispatchable gap by 2030. The remainder must come from natural gas — politically constrained by moratoriums and permitting delays — from renewables paired with storage at a scale that does not yet exist, or from demand-side adjustment. "Demand-side adjustment" means some of the data centres do not get built, or do not get powered when built.
The nuclear deals are real and useful. They are also a <2% solution to a 100% problem. They are best understood not as the answer to the constraint, but as evidence the hyperscalers are aware of it — buying optionality, hedging against the PJM-signalled price increases. They are not solving the bottleneck; they are insuring against it.
IV. The Iron Law
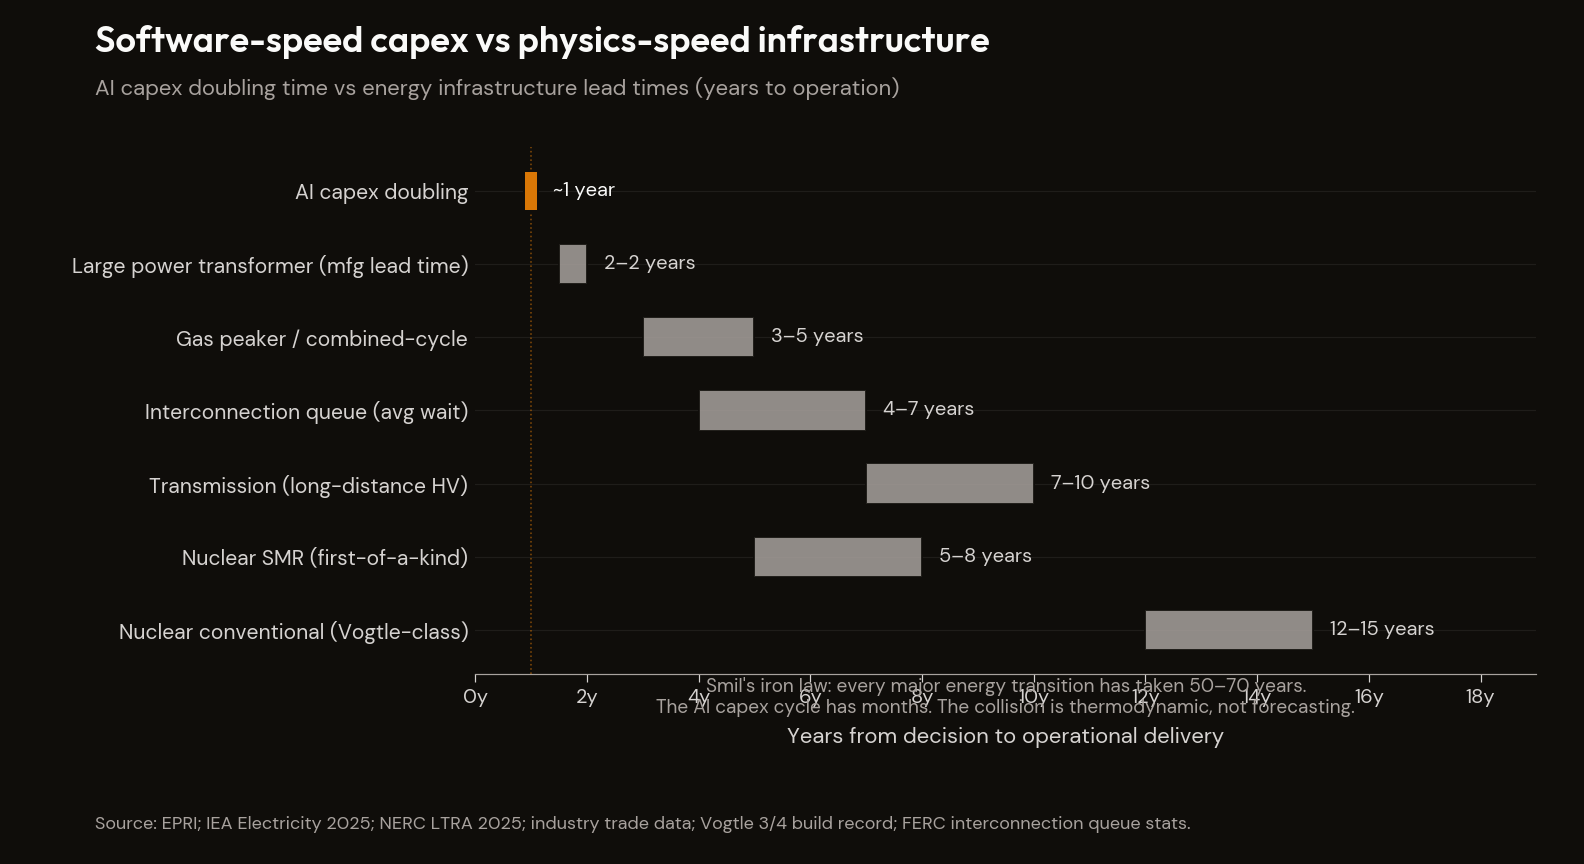
Vaclav Smil has spent forty years documenting the empirical history of energy transitions, and his work is the right scholarly anchor here because it is fundamentally arithmetic. Energy and Civilization (2017), How the World Really Works (2022), and most recently Speed (April 2025) all rest on the same observation: every major historical transition between primary energy sources has taken between fifty and seventy years from first commercial introduction to majority share. Coal displacing wood took eighty years; oil displacing coal, seventy-five; natural gas displacing coal in electricity generation, beginning in the 1970s and projected to reach majority share around 2050 — eighty years and still incomplete. There is no historical precedent for a primary-energy transition completing in under fifty years, and no physical mechanism that would make the AI-era transition different. Smil's framing of the post-2000 "energy transition" narrative is unambiguous: there is no transition. The world is not replacing fossil energy with renewable energy. It is adding renewable energy on top of existing fossil energy. Global coal generation rose from 9,500 TWh in 2015 to 10,200 TWh in 2025; natural gas rose 26%; renewable generation doubled, but as supplement, not substitute. The renewable share of global primary energy crept from 11% to 14% over the decade, in a system where absolute fossil-fuel use increased.11 The iron law that governs the AI-and-energy collision follows: capital cycles in the technology sector run on five-to-ten-year horizons; energy infrastructure transitions run on fifty-to-seventy-year horizons. The mismatch is thermodynamic and industrial, not forecasting.
This is one of the manuscript's recurring motifs — addition, not substitution. Energy is the cleanest case, but the same dynamic appears in The Demographic Crunch (immigration adds to ageing native cohorts; it does not replace them) and in The Math Doesn't Work (stablecoin issuers add to Treasury demand as foreign holders reduce; they do not substitute on a one-to-one basis). The mispricing is consistent across the three: Western policy and capital markets price substitution models; physical evidence shows addition.
Mark Mills, at the Manhattan Institute, makes the point in a polemical register and quantifies it. Mills's argument turns on the impossibility of compressing the energy build-out onto the pace of digital-technology progress: the physics of energy refuses the analogy. His specific claim is that the United States requires an additional $70 to $100 billion per year of energy capex above the current trajectory to keep pace with AI-driven demand growth.12 Goldman Sachs's Generational Growth report (April 2024, Murti and Schneider) is the Wall Street articulation of the same point: AI as a third super-cycle in US energy demand, comparable to the electrification wave of the 1900s and the air-conditioning roll-out of the 1950s. Required cumulative power-infrastructure capex over the decade: roughly $1.4 trillion. Current trajectory: roughly $700 billion. Both estimates converge on structural under-investment of approximately $70 to $100 billion per year, sustained over a decade.13
Jonathan Koomey is the most credible empirical skeptic on data-centre energy demand. The 2020 Masanet et al. paper in Science established that prior decades' projections were systematically overstated by three to four times, because efficiency gains from virtualisation, consolidation, and improved cooling absorbed most of the projected growth.14 Koomey's 2025 commentary is more specific. AI-driven demand is real and has been understated in some recent analyses, with data-centre consumption growing at 20% to 25% annually against dispatchable capacity growth of 3% to 5% annually. Efficiency gains in chip design, cooling, and workload allocation will partially compress the trajectory — perhaps by 15% to 20% per year. The honest framing: Koomey does not disagree with the bottleneck thesis; he believes the gap is somewhat smaller than the alarmist case implies. The bottleneck thesis requires only Koomey's own central estimate — 20% demand against 5% capacity — and the arithmetic still produces a binding shortfall by the late 2020s.15
Goehring & Rozencwajg, in their 2025 quarterly research, articulate the constraint from the commodity-investor angle: policy-driven supply suppression — drilling moratoriums, pipeline cancellations, coal-plant retirements — has structurally constrained dispatchable supply at exactly the moment AI demand is accelerating, with the flow-through visible in natural gas, uranium, and coal prices and in capacity-market clearing.16 The engineering reality check tightens further: the binding constraint on grid reliability is not total installed megawatts but inertia and frequency response — the synchronous generation (large rotating turbines, predominantly coal, gas, nuclear, hydro) that keeps grid frequency stable. As that synchronous generation retires and intermittent renewables replace it on a nameplate-megawatt basis, the grid loses operating margin even where total capacity is maintained.
Synthesise the scholarly framing. Smil establishes the historical base rate: 50 to 70 years, no exceptions. Mills and Goldman quantify the capex gap: $70 to $100 billion per year of structural under-investment. Koomey provides the empirical skeptic case, and the gap survives even on his assumptions. Goehring & Rozencwajg trace the commodity flow-through. Five vantages, five methodologies, one converging conclusion: the grid cannot be built fast enough to meet the demand the AI capex cycle is generating.
V. The Honest Counter-Arguments
The bull-case rebuttals to the bottleneck thesis deserve to be engaged directly, not waved off. Five are worth taking seriously.
First, efficiency gains will absorb most of the demand growth. This is Koomey's own optimistic case, and it has empirical pedigree. Each generation of AI chips — Hopper, Blackwell, Rubin, the next — delivers substantially more compute per watt than the prior. Cooling technology has improved. Workload allocation across data centres has improved. The Koomey-style argument is that efficiency gains compress demand growth from a hypothetical 50% annually to something closer to 20%, which the grid can plausibly accommodate.17
The counter to the counter is Jevons's paradox: every prior efficiency gain in computing has increased, not decreased, total electricity consumption. Cheaper compute per watt has historically driven demand for more compute, faster than efficiency gained ground. The same dynamic is now visible in AI inference: as inference cost-per-token falls, demand for inference expands faster than the per-token efficiency gain. The current trajectory of frontier-model deployment — every consumer-software application racing to integrate AI features, every enterprise workflow under reconstruction around copilots — is expanding the addressable market for AI inference faster than chip-level efficiency is reducing per-query power requirements. The historical base rate for computing-efficiency gains and total-demand outcomes is unambiguous.
Second, behind-the-meter generation will solve it. Hyperscalers can build on-site gas turbines, batteries, and (eventually) SMRs that bypass the grid-interconnection queue. Microsoft's behind-the-meter gas-turbine deployments in Texas and Virginia have grown through 2025. Even maximally aggressive scenarios add roughly 10 to 20 GW by 2030, against the 80 to 100 GW dispatchable shortfall — perhaps 15% to 20% of the gap. It also creates a carbon-disclosure problem: running on-site gas turbines is a measurable emissions-intensity increase the industry's ESG framing has been constructed to deny.
Third, AI productivity gains will reduce non-AI electricity demand. The time-lag from AI deployment to measurable reduction in non-AI electricity demand is on the order of ten years; the AI-driven increase is happening over the next four. The two curves do not intersect helpfully.
Fourth, renewables-plus-storage will scale faster than the brief assumes. The binding constraint on the build-out is interconnection, not generation cost. A solar farm can be built in eighteen months; a grid connection cannot — the average wait is five years and worsening. Transmission is 2× slower than generation. The thesis is correct on cost; wrong on timeline.
Fifth, Mills overstates and Smil's history doesn't apply to digital-age transitions. Vogtle 3 and 4 were completed in 2023 and 2024 with full access to current AI-tools assistance, and ran fifteen years and 260% over budget. The interconnection-queue clearing rate in 2025 was slower than 2020, not faster. Lead times for large power transformers extended over the same period. None of the empirically observable productivity gains in the energy-infrastructure sector are reducing build timelines as of 2026.
The honest summary: each counter contains a real mechanism; none is fanciful; none is large enough on the binding timeline to close the gap. Together they suggest the gap will be narrower than the most alarmist projections imply. Together they do not close it.
VI. The Timeline Inversion
Capital cycles in the technology sector have collapsed to five-to-ten-year horizons. AI model generations turn over in eighteen to twenty-four months. Chip design cycles are roughly two years from architectural decision to silicon volume; production cycles are months. The financial markets that fund this operate on quarterly horizons and reward execution speed.
Energy infrastructure cycles have not collapsed. They have lengthened. Conventional large nuclear: ten to fifteen years from groundbreaking to commercial operation. Combined-cycle gas: three to five years from permit to operation, before grid connection. Long-distance high-voltage transmission: five to ten years from proposal to energisation. Large power transformers: eighteen to twenty-four months of manufacturing lead time. NEPA and state environmental review: routinely five to seven years for major projects. The skilled-labour pool — linemen, nuclear operators, transmission engineers — has shrunk over decades of low energy capex; rebuilding it takes ten years and is not under way at scale.
The two cycles are now operating against each other. Hyperscalers are committing to 2027–2028 data-centre construction on the assumption that power will be available; the infrastructure that needs to be operational in 2027–2028 had to begin permitting in 2020–2022. Most of it did not. Forward visibility on dispatchable capacity additions through 2028 is roughly fixed; the collision point is now.
This is the iron-law constraint Aschenbrenner's framework explicitly does not engage. Situational Awareness projected that the trillion-dollar cluster would require roughly 100 GW of dedicated power by 2030 and treated the build as a question of capital allocation and political will — "the barriers to even trillions of dollars of datacenter buildout in the US are entirely self-made."6 The argument is rhetorically clean and arithmetically wrong. The barriers are partially self-made (NEPA, transmission siting, climate-policy moratoriums on gas), but they are also partially physical (transformer manufacturing lead times, skilled-labour shortages, the construction sequence for nuclear plants and gas turbines). The self-made portion can be removed by policy. The physical portion cannot be removed by capital. Aschenbrenner's framework assumes a software-speed transition; Smil's iron law says no such transition has ever been achieved. The next four years will adjudicate which is right.
There is one consequence of the timeline mismatch that Aschenbrenner anticipated with unusual precision. "We're going to drive the AGI datacenters to the Middle East, under the thumb of brutal, capricious autocrats," he wrote in June 2024.6 In May 2025, OpenAI, Oracle, SoftBank, Nvidia, and the Emirati state holding G42 announced Stargate UAE — a 1 GW Abu Dhabi cluster, with 200 MW expected operational by 2026 and a multi-gigawatt roadmap thereafter.18 The American AGI-datacenter geography began to leak abroad eleven months after the warning. The leakage is not the manuscript's argument. It is the empirical confirmation that the supply-side constraint, when it binds, does not get solved by the capital-allocation mechanisms that work for software-speed inputs. It gets solved by relocating the capital to a jurisdiction where the supply constraint does not bind, on terms set by the host state.
The AI Reckoning makes the case that the productivity gains required to underwrite the $725 billion 2026 hyperscaler capex are not achievable on the timeline financial markets are pricing. The energy bottleneck is a separate, prior constraint: even if those productivity gains were available, the data centres required to deliver them cannot be powered. The capex thesis is not just optimistic on outputs; it is impossible on inputs.
VII. The Binding Constraint
The AI capex thesis has made a category error: it has treated electrical power as a software-speed input when power is, has always been, and will remain a physics-speed input. The collision between the two cycles is binding now and the price signals are already showing it.
- NERC's January 2026 LTRA revised the ten-year US summer peak demand outlook upward by +224 GW (+69%) — the largest single-year revision in the assessment's history.
- EIA, EPRI, and IEA independently revised data-centre electricity demand upward in the same window; data centres are projected to be 50% to 80% of incremental US electricity demand growth through 2030.
- PJM's capacity auctions cleared at the FERC price cap of $329.17 per megawatt-day for two consecutive years — approximately eleven times the 2024 clearing price — the textbook signature of a binding physical constraint.
- Hyperscaler nuclear PPAs total 4.5–6.6 GW of announced commitments, of which approximately 1.8 GW is net new by 2030, against 80–100 GW of hyperscaler-driven demand growth — a coverage ratio under 2%.
- Vogtle 3 and 4: 15 years and $36.8 billion for 2.2 GW. SMRs at commercial scale are realistically a 2030–2032+ technology.
- Smil's iron law: every major historical energy transition has taken 50 to 70 years, no exceptions.
The hyperscaler thesis depends on three independent claims, each addressed by a separate essay: that the consumer-revenue base can support the growth (it cannot — The AI Reckoning, §§I–V), that productivity gains can be delivered on financial-market timelines (they cannot — The AI Reckoning, §§VIII–IX), and that the dispatchable power can be built on the capex schedule (it cannot — here). All three point at the same window: 2027–2028.
When constraints of this kind bind in tightly-coupled financial-and-industrial systems, the adjustment is not smooth. It is discontinuous — a phase transition in which prior pricing relationships, capex plans, and growth assumptions abruptly reset. These adjustments happen, when they happen, in discrete steps, often clustered, often during a single quarter, often without warning.
The AI hyperscaler triad has been priced as if all three legs were operating in a regime of indefinite extrapolation. The data describes a regime in which one is now demonstrably binding, and the other two depend on the assumption that it will not. The signature is already in the data: NERC's revised forecast, PJM's capped clearing price, the nuclear arithmetic that does not add up.
The remaining question is when the recognition arrives in equity markets, and through what mechanism.
Footnotes
-
PJM Reliability Pricing Model — capacity auction results portal. ↩ ↩2
-
EIA Annual Energy Outlook 2026 — release presentation (April 2026). ↩
-
EPRI — Powering Intelligence: Analyzing Artificial Intelligence and Data Center Energy Consumption. ↩
-
Leopold Aschenbrenner, Situational Awareness: The Decade Ahead (June 2024); all quoted passages from Section IIIa, "Racing to the Trillion-Dollar Cluster." ↩ ↩2 ↩3 ↩4
-
Constellation Energy — Crane Clean Energy Center / Three Mile Island Unit 1 restart announcement (Sept 2024). ↩
-
Talen Energy — expanded nuclear PPA with Amazon at Susquehanna (June 2025). ↩
-
Google — Kairos Power nuclear energy agreement (Oct 14, 2024). ↩
-
Meta — Nuclear energy partnerships with Vistra, TerraPower and Oklo (Jan 9, 2026). ↩
-
Vaclav Smil, Energy and Civilization: A History (MIT Press, 2017); How the World Really Works (Viking, 2022); Speed (April 2025). Quantitative anchor for the addition-not-substitution claim: Smil — "Halfway Between Kyoto and 2050" (open paper, hosted via EnergySkeptic). ↩
-
Mark P. Mills — The Energy Transition Delusion: A Reality Reset (Manhattan Institute). ↩
-
Goldman Sachs Research — Generational Growth: AI, data centers and the coming US power demand surge (Murti & Schneider, April 2024). ↩
-
Masanet, Shehabi, Lei, Smith & Koomey — "Recalibrating global data center energy-use estimates," Science 367(6481), Feb 2020. ↩
-
Jonathan Koomey — A Skeptic's Take on AI Electricity Load Growth (Latitude Media / Catalyst, 2025). ↩
-
Lawrence Berkeley National Lab — 2024 United States Data Center Energy Usage Report (Shehabi, Smith, Masanet et al., Dec 2024). ↩