The Math Doesn't Work
In 60 seconds
Federal debt held by the public is approaching 100% of GDP; net interest now exceeds defence spending; OASI (Social Security's retirement trust fund) runs out of redeemable IOUs by 2032; the bottom half of US households cannot cover a $1,000 emergency. The math is fully visible — six forces moving in the same direction with no fiscal room left to absorb any of them. The default is the statutory cut. Someone bears the cost; the political system decides who.
The fiscal math of the United States does not work. It is not a question of will or politics. It is a question of arithmetic. And once you accept that the math doesn't work, every other big question — about asset prices, about the dollar, about jobs, about what happens to a country that has promised more than it can deliver — becomes a question of how the arithmetic forces itself to balance, and over what timeframe.
Two things to disclose before going further. I write this from Cape Town: a South African chartered accountant looking at the United States from the outside, which will matter when I get to the section on emerging-market credit. And I run a business that automates professional-services work — meaning I am, in the small, on the supply side of the labour displacement I will be describing in the AI section. Neither makes me less interested in getting this right. Both should make me more honest about it.
The thesis I think is largely correct: the United States is running a permanent structural deficit on a debt stock that compounds against shrinking demographic productivity, the political system is incapable of acting on it in advance, several speculative bubbles are inflating in the same window (the largest in AI infrastructure capex), and trust in the institutions that would have to manage a transition through this has reached levels no postwar government has had to operate inside. Three threads without which the diagnosis does not work: the household balance sheet that everything else sits on top of (a population without buffers, without assets, without any meaningful capacity to absorb the shocks the macro forces are queuing up); the labour-market thread that links the AI capex bubble to the entitlement math through lower payroll tax revenue; and the actual location of credit-market stress in 2025 and 2026.
Six forces, current numbers
| Force | Headline number | Watch trigger | Where in essay |
|---|---|---|---|
| 1. Debt math | Debt/GDP ~100%; net interest > defence since FY2024 | 2026 Trustees Report; auction bid-to-cover | §1 |
| 2. Household balance sheet | 4 in 10 cannot cover $400 emergency; revolving APR >21%; subprime auto 32-yr delinquency record | Consumer credit-card serious delinquency | §2 |
| 3. AI math | Capex/revenue gap ~16×; Mag 7 = 31% of S&P market cap | Hyperscaler FCF turn; Anthropic round | §3 |
| 4. Entitlement math | OASI depletion 2032 (CBO) / 2033 (Trustees); 23–28% statutory cut on depletion | 2026 Trustees Report; OASI legislation | §4 |
| 5. Institutional math | Federal-government trust at 17%; ~30% accept political violence | V-Dem US sub-indices; Fed Board composition | §5 |
| 6. Demographic math | Worker-to-beneficiary ratio 5:1 → 2.7 → 2.3 by 2040 | Migration data; CBO labour-share assumption | §6 |
Here is what each force actually looks like at the end of April 2026.
1. The debt math
Federal debt held by the public is approaching 100% of GDP, on track to pass the postwar peak this year and to keep climbing through the 2030s under any assumption set CBO is willing to publish.1 The structural deficit is running at roughly two trillion dollars a year and widens from here. None of this is cyclical. It is the new baseline.
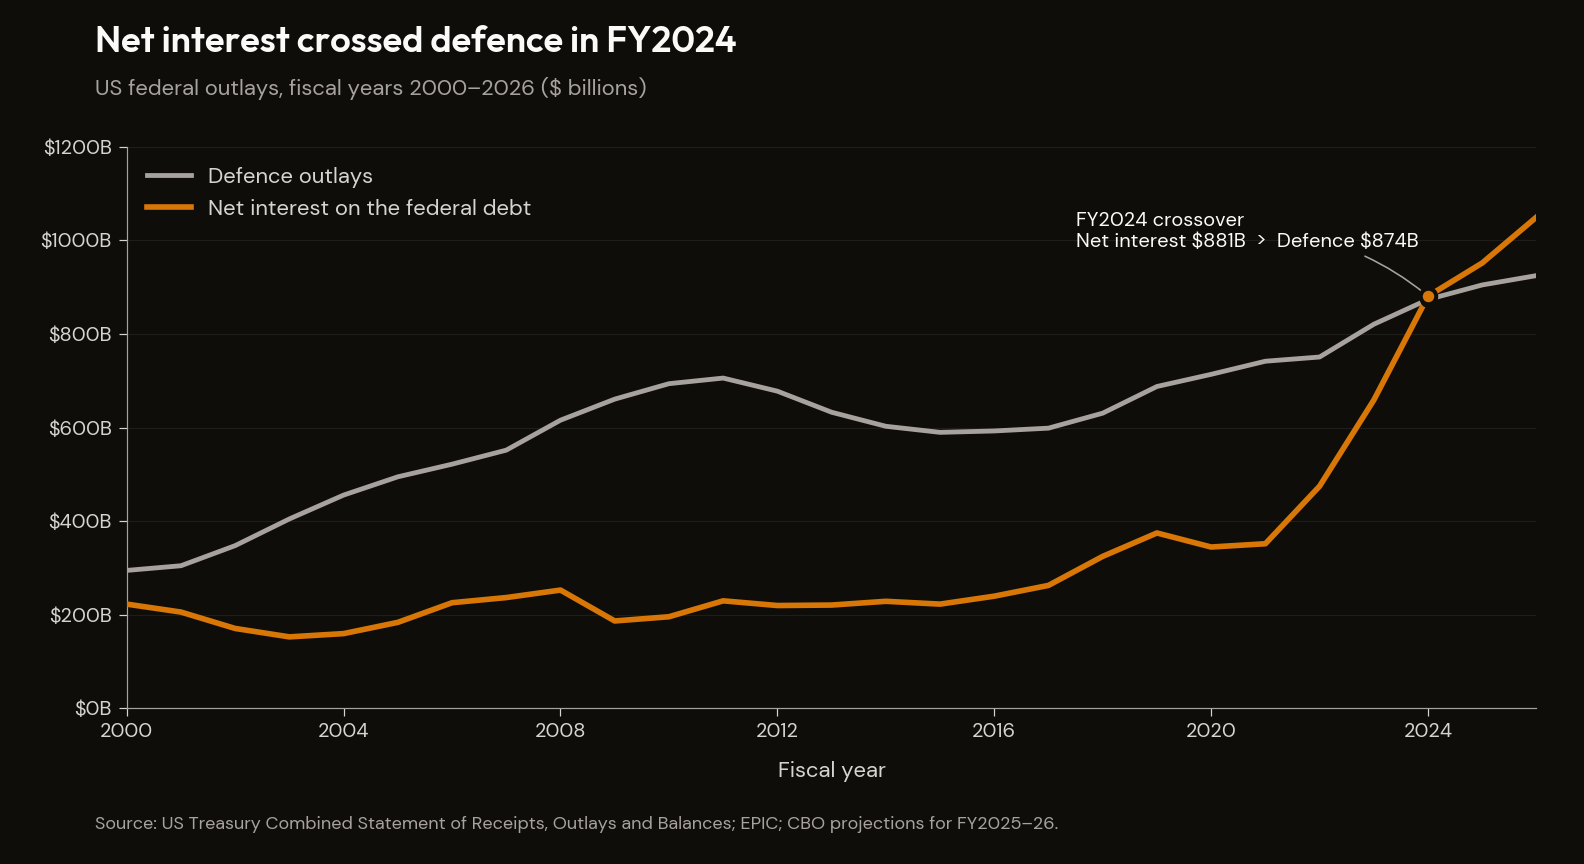
The visceral fact is that net interest on the federal debt now exceeds the entire defense budget. The crossover happened in fiscal year 2024 — net interest of $881 billion against national defence of $874 billion (US Treasury Combined Statement, FY2024) — and the gap has widened in every fiscal year since. One dollar in five of every tax dollar collected currently services debt; the fifty-year average is twelve cents.2
There is a maturity wall. About a third of all marketable Treasury debt matures in FY2026 alone, much of it issued during 2020–2021 at coupons of one to two percent and now being refinanced at four-percent-plus. This is not a forecast. It is a mechanical event in progress.
The one fiscal lever that was actually working in 2025 — tariff revenue — is gone. The Supreme Court struck down the IEEPA-based tariff regime in February 2026, and the resulting termination added another two trillion dollars to projected deficits over the next decade. The administration pivoted to other tariff authorities, but the headline revenue argument is judicially dead.3
The One Big Beautiful Bill Act, signed July 4 2025, was the dominant post-December fiscal development and added another four trillion dollars of cumulative deficits, extended the 2017 tax cuts, and was certified by the SSA chief actuary as advancing Social Security trust-fund depletion by a year.4
Mandatory spending plus net interest already approximately equals total federal revenues. Every dollar of discretionary spending — defence, scientific research, infrastructure, education, foreign policy, the entire visible work of the federal government — is borrowed. By the mid-2030s, Social Security, Medicare and net interest alone will consume nearly six dollars of every ten the federal government spends. The visible debt is also only the surface; what sits underneath it is several multiples larger, and Force 4 is the section that surfaces it.
2. The household balance sheet
This is the ground the sovereign math rests on. Use the actual data.
As of April 2026, the median American adult cannot cover a $1,000 unexpected expense from savings, carries revolving credit card debt at twenty-one percent interest, lives paycheck to paycheck, holds essentially no equity in financial markets or real estate, and works in an occupation that automation researchers identify as carrying significant displacement risk. That sentence is a synthesis. Each clause is verifiable. The point is the cumulative posture, not any individual statistic.
The Federal Reserve's annual household survey continues to find that roughly four in ten Americans cannot cover a $400 emergency with cash on hand. The Bankrate version of the same question, set at $1,000, finds about six in ten cannot. One in four adults has no emergency savings at all.5 6 A clear majority of US consumers live paycheck to paycheck — including roughly four in ten of those earning over a hundred thousand dollars. This is not a low-income story alone.7
Total US credit card balances are at a record. Average APR on revolving balances is above twenty-one percent. Cumulatively, household interest payments on revolving balances are running at hundreds of billions of dollars a year — a structural transfer from the bottom half of the wealth distribution to the financial sector.8
Subprime auto sixty-day delinquency just hit a thirty-two-year record. Just over a fifth of new auto originations are now seven-year terms. The average new-car payment is in the high seven-hundreds per month, comfortably above ten percent of gross income for the median single-earner household, before insurance and fuel.9
The bottom half of US households holds about two and a half percent of total household wealth, and roughly one percent of equities. The five-year equity bull run was almost entirely a wealth event for the top quintile.10
Several million borrowers, holding well over a hundred billion dollars, are in active default on student loans as of December 2025; the delinquency rate on balances in active repayment is roughly half again what it was in 2019. The SAVE plan was judicially terminated. Wage garnishment for defaulted borrowers resumed in early 2026.11
Half of US renter households are housing cost-burdened — a record figure.12 The post-2020 inflation has not been reversed; it is the new baseline. A household running a roughly four-thousand-dollar monthly budget in January 2020 needs about five thousand to maintain the same standard of living now.13
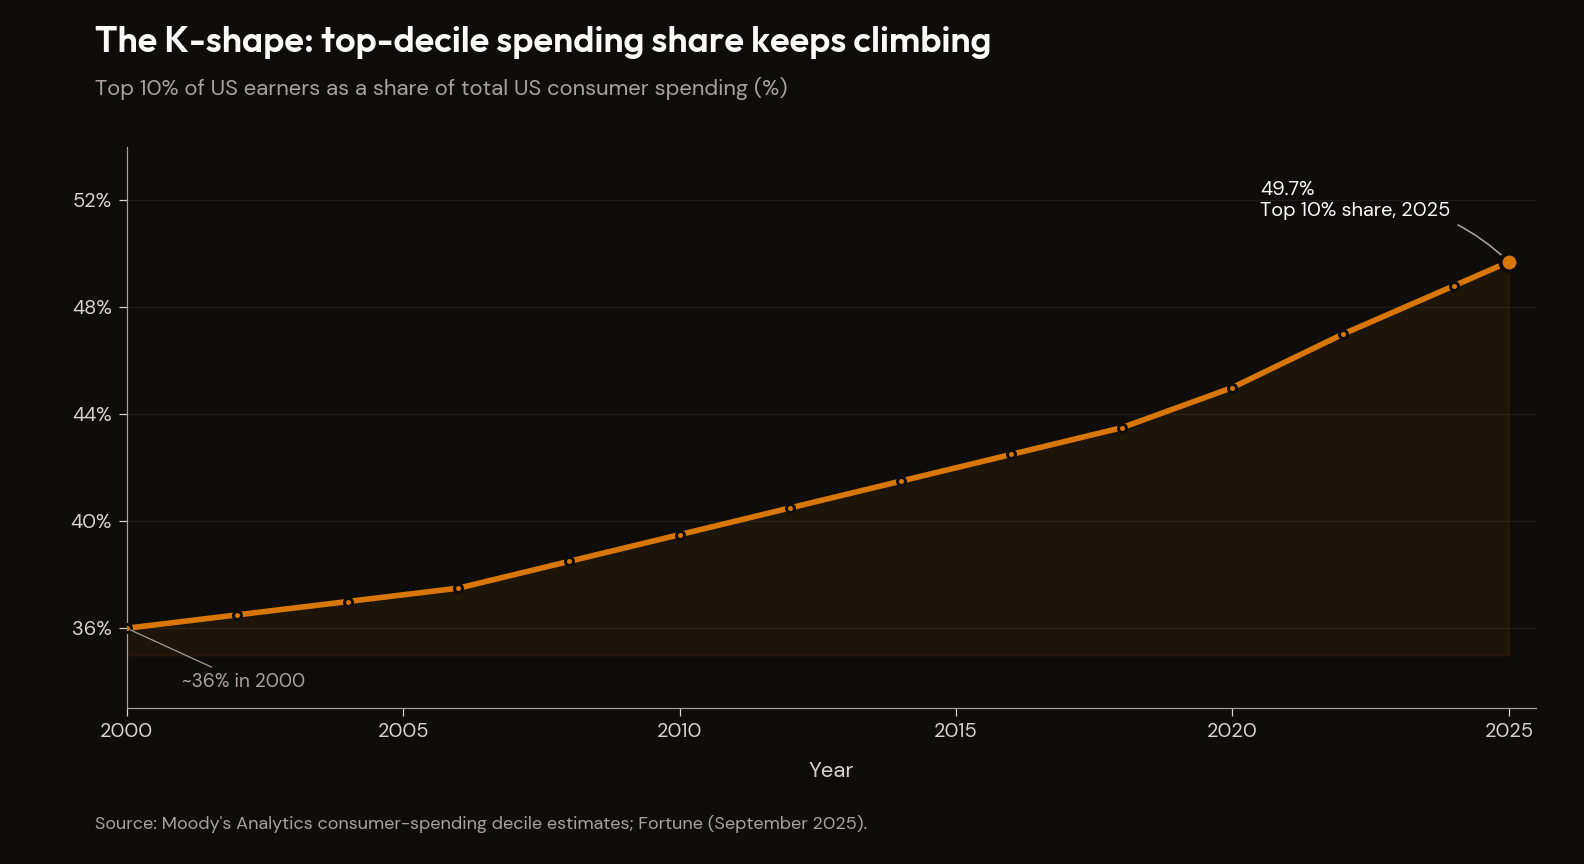
The K-shape has continued to steepen. The top ten percent of earners now account for nearly half of all US consumer spending, the highest share in the modern series. Aggregate retail sales prints can stay resilient even as the median household is under acute financial stress, because the median household is no longer the driver of aggregate consumption data.14
The asset-price regime built on this household balance sheet is mechanically symmetric to it: the mechanical bid (developed in The End of the Bull Run) reverses with required minimum distributions kicking in at 73, rising to 75 by 2033.
Now connect this to Force 3 below. The same workers in the most AI-exposed occupations are the same households that cannot cover a $1,000 emergency. Clerks, retail workers, administrative assistants, customer-service agents are concentrated in the income bands where savings are zero and consumer credit is at twenty-one percent. The "AI-adjacent" jobs that might absorb the displaced overwhelmingly require master's degrees the displaced do not have. The financial runway needed to retrain — a year or two of reduced income — does not exist in those balance sheets.
This is the floor. When the median household has no buffer, the political and fiscal response space to any additional shock contracts dramatically. The historical playbook — absorb technological unemployment through expanded safety nets, time, and retraining — assumes households have months to years to adjust. The data above describes a population with weeks.
3. The AI math
The bubble is real. It is not the whole story.
The capital expenditure number first. The Magnificent Seven collectively account for around a third of the entire S&P 500's market capitalisation, with NVIDIA now the single largest constituent. The concentration is historically extreme.15
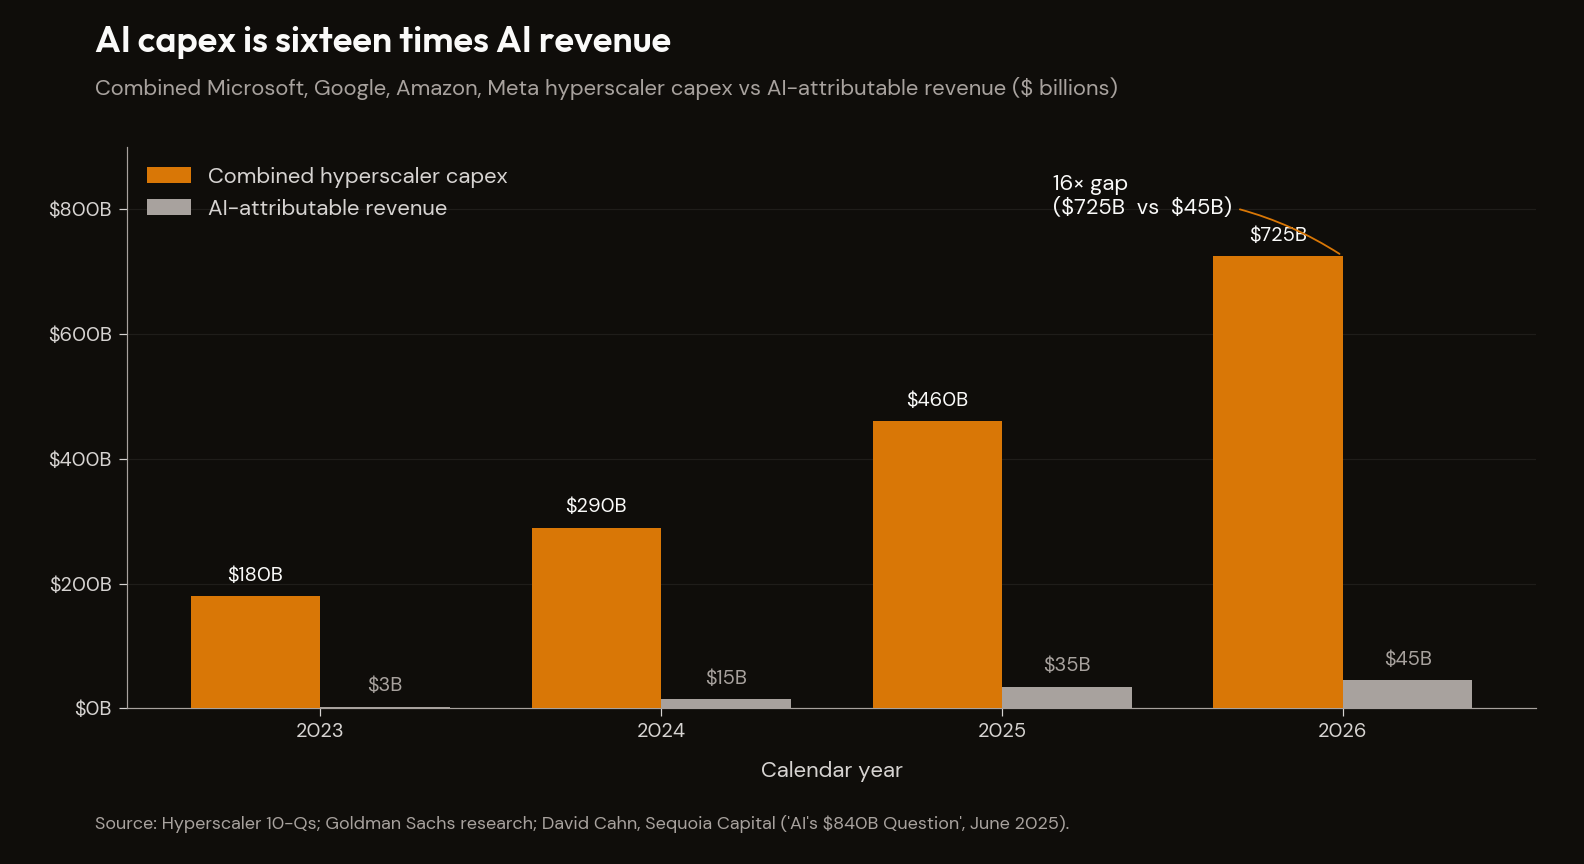
Combined 2026 guidance from the four largest hyperscalers, confirmed in the April 29 earnings reports, sits at $725 billion, up roughly three-quarters from 2025. AI-attributable services revenue at the same companies remains in the tens of billions.16 17 Capex is moving more than ten times faster than revenue. That ratio is the entire bull-versus-bubble debate, compressed.
The structurally identical historical comparison is the telecom fibre overbuild of 1998–2001. Telecom did not crash because the technology was bad; it crashed because the cash flows arrived too late, and the hyperscalers today are running capital intensity an order of magnitude above Cisco's peak. The Anthropic round circulating in private markets would close at a price-to-sales multiple a hair above Cisco's March 2000 peak.18
Three further structural facts:
DeepSeek's R1 release in January 2025 erased over $500 billion of NVIDIA market capitalisation in a single trading day by demonstrating frontier-grade performance on a fraction of the compute budget using export-controlled chips. The market shrugged. Every dollar of capex committed since implicitly bets DeepSeek is a one-off rather than the leading edge of an efficiency curve.19
The grid is now the binding constraint, not the capital. IEA projects global data centre electricity consumption in 2026 at roughly Japan's entire national consumption. PJM capacity prices have risen tenfold in twelve months; transformer lead times are two-to-four years; roughly 30% of newly planned capacity is designed to operate off-grid via on-site generation, up from effectively zero a year ago.20
Sovereign capital is functioning as buyer of last resort. UAE and Saudi Arabia have collectively committed over $100 billion to AI infrastructure; the US approved export of advanced chips to both countries in November 2025. Sovereign wealth funds can deploy capital at a scale and over a timeframe that private investors cannot match.21
The American version of this dynamic has been forecasted but has not arrived in the forecasted form. Aschenbrenner's June 2024 Situational Awareness predicted "Congress to appropriate trillions for chips and power" by 2027 or 2028, in what he called The Project.22 Twenty-three months on, the political conditions are receding rather than approaching — Stargate's $500 billion is private capital with White House cheerleading, not a government project. The fiscal demand has been deferred, not eliminated, and the bull case for AI ultimately requires a sovereign fiscal posture this essay says is gone.
The Mag 7 basket is fragmenting. Hardware names like NVIDIA hit new highs in April; software deployers like Microsoft are deep in correction. Picks-and-shovels at peak, deployers under pressure — that is what late-cycle bubbles do before they break.
The labour-market thread
Goldman's chief economist Jan Hatzius walked back the house's 2023 "AI raises global GDP by 7%" forecast in February 2026: "AI added basically zero to US GDP growth in 2025." The chips are imported, the GDP accrues to Taiwan and Korea, and perhaps 0.2 of the 2.2% US growth came from AI investment.23 Acemoglu's framework brackets ten-year cumulative TFP impact at 0.66% upper bound — roughly an order of magnitude below Goldman's original number.24
The productivity has not arrived. That is the bull-case rebuttal. The bear-case sharpening: the displacement is arriving in the data, before the productivity is.
The cleanest piece of work is from the Stanford Digital Economy Lab. Brynjolfsson, Chandar, and Chen used ADP's high-frequency payroll records covering millions of US workers and isolated automative from augmentative AI applications. The finding: a 13% relative decline in employment for workers aged 22–25 in the most AI-exposed occupations since late 2022 (after controlling for firm-level shocks), while workers aged 30+ in the same occupations gained 6–8%.25 One caveat to record on first reference: the Stanford finding is one identification strategy on one dataset. It is the strongest single piece of empirical work on AI labour displacement currently published, and it has not yet been replicated against the BLS or other primary series. The manuscript treats it as directional rather than settled, but the direction is the point. Goldman's own labour desk calculated a net loss of 16,000 jobs per month from AI substitution exceeding augmentation, concentrated among workers under thirty.26
Software engineering job postings sit at roughly two-thirds of their February 2020 level; junior listings further still.27 Recent-graduate unemployment was higher last quarter than at any point during the 2008 financial crisis.28 Meta, Microsoft and Salesforce cut more than twenty thousand white-collar roles between Q4 2025 and Q1 2026; Salesforce's CEO Marc Benioff said publicly, "I need less heads." Two-thirds of CEOs in the latest survey plan to freeze or cut hiring through 2026.29
The honest counter-point: aggregate unemployment is 4.3%. Yale Budget Lab, the Federal Reserve, and McKinsey have variously concluded "no AI jobs apocalypse — for now." Klarna walked back its full-AI customer service strategy in 2025; HR Executive estimates roughly half the AI-attributed layoffs of 2025 will be quietly reversed, often offshore at lower pay.30 The headline panic is overstated.
The right frame is narrower and harder to dismiss. The claim is not that AI is causing mass unemployment; it is that the bottom rungs of the white-collar career ladder are being removed first. You do not need an unemployment crisis for the system to crack. You only need the career escalator to break — and the escalator is what funds entitlements through payroll taxes, justifies college debt, produces senior workers two decades later, and underwrites the political legitimacy of capitalism for non-elite households.31
The hardest connection — and the one the labour data forces — is to Force 4 below. Every 22-year-old not getting hired into an entry-level job is a 45-year future of foregone payroll-tax revenue that the trust fund actuarial projections never priced in. The CBO's deficit projections assume labour share of GDP holds roughly stable. The Brynjolfsson and Goldman data suggest that this is the assumption most likely to break first.
Productivity is late. Displacement is on time. That is what a bubble looks like before it ends.
The AI–private credit fusion
The AI capex bubble and the private credit bubble are no longer separate stories. They are the same story, with the same end-investor.
Hyperscaler capex is increasingly debt-financed rather than funded from free cash flow. Over a hundred billion dollars of new hyperscaler debt was issued in 2025 alone, with Wall Street strategists projecting well over a trillion more to finance the buildout. Amazon is projected to turn free-cash-flow negative in 2026 for the first time in years.32
The structural template is CoreWeave. Its multi-billion-dollar GPU-collateralised loan facility, which closed in March 2026 as the first investment-grade-rated debt of its kind, had Blackstone Credit & Insurance as the lead investor block. The AI bubble is now financed by the private-credit complex, which sits inside insurance balance sheets.33 Roughly a third of the US life insurance industry's assets are now in some form of private credit. Apollo's insurance arm alone has converted tens of billions of dollars of corporate pension obligations from companies like Alcoa, AT&T and Lockheed Martin into annuities, a meaningful share backstopped offshore in Bermuda.34
The connection back to the AI capex bubble: every dollar of hyperscaler capex is now also a dollar of private-credit bubble. If Anthropic closes a $900 billion round, if AI revenue keeps lagging capex by an order of magnitude, if the NVDA-as-buyer-of-last-resort dynamic falters, the stress does not stop in the equity market. It transmits, through the debt that funded the buildout, into private credit funds, into BDC marks, into life insurance balance sheets, and out the other end into annuity payments to retirees. This is the integrated bubble.
4. The entitlement math
Three legally distinct trust funds.
Social Security OASI (retirement and survivors): the 2025 Trustees Report projects depletion in 2033. The CBO, after incorporating the One Big Beautiful Bill Act, moved the date to 2032. Six years from today.
Medicare HI (Part A, hospital insurance): Trustees say 2033. CBO says 2040, a seven-year methodological gap on Medicare cost-growth assumptions that I do not think gets resolved in the optimistic direction.
Disability (DI) is solvent through 2099 and is not the issue. Medicare Part B (outpatient) and Part D (drugs) are funded by general revenue and are not subject to automatic cuts on trust-fund depletion. They face only appropriations politics.
When OASI depletes, the cut is 23% (Trustees) or 28% (CBO 2032 scenario), automatic, by operation of law. When HI depletes, the cut is 11%, applied to hospital and inpatient reimbursement only.
The political framing of this is inverted from where most people start. The default is the cut. No Congressional vote is required for benefits to be reduced. A vote is required to prevent the reduction. The Antideficiency Act and the Supreme Court's 1990 decision in OPM v. Richmond settled the underlying mechanics decades ago. SSA has no borrowing authority. When the trust fund hits zero, it pays out only what payroll tax brings in that year. Tens of millions of seniors get a smaller cheque, immediately, unless Congress has acted in advance.
The serious bull-case rebuttal — and the one this essay owes a direct answer to — is the empirical record. Congress has voted around the legal default before. The 1983 Greenspan Commission produced a bipartisan package of payroll-tax increases and retirement-age deferrals that pulled OASI back from the brink. The 1997 Balanced Budget Act delivered a comparable bipartisan correction at a different fiscal pressure point. The case from this record is straightforward: when the cliff is close enough, Congress acts. The legal default is a forcing function, not a fate. The 2010 Simpson-Bowles framework is in the record as a contested case the other way — a bipartisan attempt that failed even with credentialed elite consensus and a freshly re-elected presidency. The historical record carries both: the vote-around when conditions allow, and the failure when they do not.
I do not dispute the historical record. I dispute that it forecasts the 2026–2027 political configuration. Three of the conditions that made 1983 possible are absent: a bipartisan Senate willing to share authorship, a presidency willing to spend political capital on entitlement reform inside an electoral cycle, and a fiscal posture with room to absorb the giveaways that always accompany a deal. The political amplifier described in §5 — federal-government trust at 17%, civil-service institutional memory thinned, FOMC composition under live conflict — describes a transmission system in which a Greenspan-Commission-style deal is less likely than the historical base rate suggests, not more. The demand-side trap in §2 makes the political fee for a deal that touches benefits steeper than any in the available record. The vote-around may still happen; it has every prior cycle. The manuscript's claim is that the configuration in which the cliff arrives is structurally adverse to it in ways the historical record does not capture. The default is the cut not because Congress is incapable of voting otherwise, but because the marginal vote-around requires political conditions the 2026–2027 window does not supply.
Two 2025 laws moved the math against beneficiaries while claiming to help them. The Social Security Fairness Act (signed January 2025) repealed the WEP/GPO offsets and added an estimated $200 billion to the ten-year shortfall. The One Big Beautiful Bill Act added more. The chief actuary at SSA certified that combined effect in August 2025.
This is the irony Congress is currently performing on its own constituents.
Sensitivity: OASI depletion under three scenarios
| Scenario | Assumptions | Depletion year | Cut on depletion |
|---|---|---|---|
| Trustees baseline | Current law; intermediate assumptions | 2033 | 23% |
| CBO baseline (post-OBBB) | Current law + OBBB tax extensions | 2032 | 28% |
| Stressed | 10y yield +100bp; labour share -2pp on AI displacement | ~2031 | 30–32% |
The Trustees vs CBO seven-year gap on Medicare HI (2033 vs 2040) is unresolved. The stressed scenario assumes the labour-share assumption underwriting payroll-tax projections moves adversely on the Brynjolfsson 22-25 year-old displacement data sustaining. Both directions of the sensitivity are within the range of published estimates.
The reserves are an accounting fiction
There is a popular framing that says Social Security has "trillions in reserves". The statement is technically true and substantively misleading. The combined trust funds hold reserves entirely in non-marketable special-issue Treasury securities — IOUs the federal government has written to itself.35 When SSA "draws on the trust fund," Treasury has to find the cash to redeem those IOUs by raising taxes, cutting other spending, or issuing new marketable debt. The reserves are a claim on future federal revenues. Nothing more.
This converts an apparently slow-rolling demographic problem into an immediate cash-flow problem the moment trust-fund inflows fall below outflows. Social Security has been running annual cash deficits since 2021.36 Gross federal debt includes intragovernmental holdings — most of it the special securities held by the trust funds; as the funds deplete and redeem, those holdings convert to public debt.
That is the visible side of the iceberg. The GAO's long-term simulation, Treasury's audited Financial Report, and Kotlikoff's fiscal-gap estimates converge on a total unfunded obligation somewhere between three and four times the visible debt.37 38 The discount rates used are conservative; the population and productivity assumptions optimistic. The actual gap is probably larger.
The size of the promise, and the stack beyond it
The Trustees Report's 75-year present-value figure for Social Security and Medicare's hospital fund combined is around thirty trillion dollars — already larger than the entire current stock of debt held by the public. At infinite horizon, the combined open-group unfunded obligation runs well over a hundred trillion dollars in present value.39 40
Sitting alongside the trust-fund programs is a wider stack of obligations paid from general revenue: federal Medicaid (projected to roughly double by 2040), veterans' health and disability (accelerating post-PACT Act), federal civilian and military retirement, and state and local pensions (in the trillions, several large states below sixty percent funded). None has a Trustees Report or an automatic-cut mechanism; they compound the same pressure without the disciplining feedback, and state stress flows back to the federal level through Medicaid match formulas and direct aid.41 42 43 44
5. The institutional math
The fiscal regime described above has to be managed by institutions whose transmission channels are themselves under stress.
Three institutional events in the last week of April mark the shape. Federal Reserve independence has moved from anticipatory concern to live conflict — on April 29 Powell announced he would remain on the Board of Governors after his term as Chair expires, the first such move since 1948, citing "unprecedented legal attacks"; the April FOMC vote was the most divided since 1992.45 The federal civilian workforce has shrunk by roughly an eighth between September 2024 and January 2026, concentrated among employees with twenty-plus years of tenure; institutional memory accumulated over decades cannot be reconstituted in months.46 More than a hundred career prosecutors have resigned from DOJ since January 2025, and the Acting Attorney General has stated publicly that the President has the authority to direct federal investigations.47
These are the transmission channels: a central bank whose inflation-fighting credibility premium depends on a Board composition that is now politically contested, a civil service whose memory of prior crises has thinned, and a justice system whose enforcement of contract and statute is now read by markets as a political variable. Manufacturing-job-loss populism gave the United States its 2010s political crisis. Cognitive-job-loss populism is queuing up its 2030s one — and the educated middle class write op-eds, run for office, and donate. The political economy of AI displacement does not look like the steel-towns story. It looks louder.
6. The demographic math
The demographic arithmetic sits underneath all of the above and is the subject of Essay 3. The short version: four million Americans turn 65 each year through the Peak 65 zone, the worker-to-beneficiary ratio for Social Security has fallen from 5:1 in 1960 to 2.7 today and is on track to 2.3 by 2040, and the roughly $120 trillion Great Wealth Transfer lands at exactly the moment demographic decumulation begins to overwhelm the entitlement system Force 4 describes.48 49 50 51 Essay 3 carries this through; here it is the floor the rest of the math compounds against.
Who absorbs the breakage
If the political system protects entitlements, defence, and bondholders — the only politically observable equilibrium across both parties — there is mathematically very little fiscal room left. Someone bears the cost. The bondholder bears it through inflation and yield repricing. The beneficiary bears it through automatic statutory cuts. The dollar-holder bears it through real depreciation. The taxpayer bears it through higher rates on capital and consumption. The displaced worker bears it through the absence of a safety net the political system cannot afford to expand.
The default is the cut; only the distribution is political.
Where the credit stress actually sits
The mineshaft sits in private credit and direct lending. The cascade in 2025–2026 has run on two parallel tracks. The Buy-Now-Pay-Later category that occupied early consumer-credit commentary is empirically settled — the Richmond Fed (Brief 26-05) puts charge-offs at 1.83–2.63%.52 The cascade has run through different channels.
The consumer track is visible and K-shaped. Subprime auto sixty-day delinquency at a 32-year high. Lowest-income mortgage delinquencies tripled since 2021. Klarna's longer-duration Fair Financing product showed credit-loss provisions up 102% year-over-year in November 2025. Credit-card serious delinquencies near multi-year highs. It is a slow build of stress that breaks through in the bottom decile first.53
The institutional track is mostly invisible, and that is the point. The IMF's April 2026 Global Financial Stability Report puts global private credit at roughly $2 trillion, with about $300 billion (15%) in semi-liquid structures subject to retail redemption. The Fed's November 2025 Financial Stability Report puts US private credit at $1.34 trillion and notes bank credit commitments to nonbank financial entities reached $2.5 trillion in H1 2025.54 55
The opacity of this market is now being quantified. Payment-in-kind interest by amendment has risen from 2.6% of direct lending in 2021 to 6.1% in Q3 2025. KBRA's headline default rate is 2.1%, but if PIK-by-amendment is treated as the equivalent of distressed exchange, the shadow default rate is roughly 6%, three times the headline.56 Roughly 65% of all 2025 defaults were distressed restructurings rather than payment defaults. Amend-and-extend buys time off the headline default series.57
The 2025 default events that revealed the shape of the system:
First Brands (Chapter 11, September 29 2025) — Ohio auto-parts company filed with disclosed liabilities several times its annual revenue, and a couple of billion dollars of short-term financing the bankruptcy court could not initially account for. Invoices appeared to have been pledged to multiple lenders simultaneously. Jefferies and UBS each took multi-hundred-million-dollar exposures.58
Tricolor Holdings (Chapter 7, September 10 2025) — subprime auto lender whose CEO and COO were charged in December 2025 with running a "financial crimes enterprise", allegedly double-pledging hundreds of millions of dollars of identical loan portfolios against separate warehouse lines. JPMorgan, Fifth Third and Barclays were all exposed.59
Saks Global (July 2025) — S&P downgraded three notches and described the financing package as "tantamount to a default."
Zions and Western Alliance (October 2025) — small charge-offs in absolute terms, but the loans were extended to funds investing in distressed commercial mortgages. This triggered Jamie Dimon's October earnings-call line: "When you see one cockroach, there are probably more."60
Q1 2026 redemption squeeze — the first real liquidity test of the semi-liquid private-credit structure. Blackstone's flagship private-credit fund faced the largest quarterly tender in its history. Blue Owl's two main vehicles saw redemption demand of around twenty and forty percent respectively, against gates of five percent. Fortune calculated more than a quarter-trillion dollars of market capitalisation erased across the listed alternative-asset managers in a single month.61
This is the asset-liability mismatch the IMF flagged: monthly or quarterly retail liquidity sitting on top of five-to-seven year underlying loan books. The $300 billion of redemption-eligible capital trying to exit illiquid assets is the cleanest near-term stress signal in the system.
The mortgage and CRE picture is real and worsening. Office CMBS delinquency hit 12.34% in January 2026 — a record, worse than the 2008 peak. Approximately $25 billion of CMBS is past maturity without resolution. Fifty-nine of the 158 largest banks have CRE exposure exceeding 300% of total equity capital.62 The fuse is lit.
Bond markets are confirming the stress with prices. The 10-year Treasury yield is 4.42% as of April 30, with the term premium back and "fiscal dominance" cited explicitly in market commentary.63
The dollar's plumbing is migrating
The lazy macro line of 2025 is "the dollar is losing reserve status". The actual data is more interesting.
The IMF COFER release for Q2 2025 puts the USD share of allocated reserves at 56.32%. The dollar's reserve share has fallen from roughly 73% in 2001 to 57% today — a long, slow decline, not a collapse on a one-year arc.64
What is happening is a structural migration of the dollar's plumbing. China has been a secular Treasury seller — its holdings are now roughly half what they were at their 2013 peak. But Japan remains the largest foreign holder, and total foreign holdings have actually risen by trillions of dollars since 2021. The story is China-out, rest-of-world-in, not foreign retreat broadly.
Underneath that: stablecoin issuers have become a structural new source of Treasury demand, with Tether already among the top twenty holders of US debt globally and post-GENIUS Act legislation forcing stablecoin reserves into Treasuries and overnight repo.65 66 Essay 7 owns the mechanics in full. The point that matters here is the Treasury-bid mechanism: when foreign central banks reduce their Treasury holdings, dollar-pegged stablecoins step in as buyers, and legislation has ensured they have nowhere else to put the cash. The state is absorbing the parts of crypto that work as its own demand infrastructure.
The dollar isn't dying. Its plumbing is migrating.
Gold is not voting on de-dollarization. It is voting on fiscal credibility.
Gold is at roughly $4,700 an ounce on April 28, 2026. Central-bank net buying continues at a pace not seen since the 1960s, with the People's Bank of China in its seventeenth consecutive month of accumulation.67 The IMF's April 2026 Fiscal Monitor pulled its projection for global public debt to pass 100% of global GDP forward by a year — before the end of the decade. Global net interest as a share of global GDP has risen by half in four years.68
Gold sitting above $4,700 while Treasury yields stay around 4.4% is not voting on the demise of the dollar specifically. It is voting on the credibility of the fiscal path of the entity that issues the dollar. There is a difference. De-dollarization implies a winner. Fiscal-credibility scepticism implies an arbitrage. Gold is the arbitrage.
Silver runs slightly different. 2026 will be the sixth consecutive year of structural deficit per the Silver Institute. Silver hit a record $121.60 in January 2026 and then fell 35% to $73.58 by mid-April — the volatility profile of a supply-deficit asset when industrial demand wobbles.
From where I sit
I write this from Cape Town, on a desk that pays in rand and runs in dollars. The South African vantage on a US debt thesis is very different from the New York one.
South Africa's gross debt is projected by the National Treasury to peak at 78.9% of GDP in 2025/26 and then fall to 77.3% in 2026/27 — the first projected debt peak in nearly two decades. S&P Global upgraded South Africa to BB on November 14, 2025 — the first sovereign credit upgrade in nearly twenty years. The rand has strengthened on fiscal discipline. NHI funding remains the structural overhang. But compare the local arithmetic to the IMF projection of US debt-held-by-the-public passing 100% within four years and the relative position is, for once in my career, structurally favourable here.69
The comparative cost of capital tells the same story from a different vantage. A South African corporate borrower on a five-year bond pays roughly nine percent in rand; the same borrower's US counterpart pays five-and-a-half to six percent in dollars before currency hedging. The dollar borrowing cost looks cheaper until you put the two trajectories side by side: South Africa's sovereign spread is narrowing on a falling-debt path; the US sovereign yield curve is repricing for fiscal-dominance term premium on a rising-debt path. The arithmetic of change is more important than the arithmetic of level. The cost of capital advantage that the US has enjoyed for forty years is being reduced by what its own balance sheet is doing, not by anything emerging-market borrowers are doing better. That is not a story that can be reversed by central-bank communication or by an electoral cycle.
The IMF April 2026 Fiscal Monitor projects emerging-market debt-to-GDP at roughly 50% by 2028, against developed-economy debt at roughly 85%. EM fiscal deficits are projected at 4.1% of GDP in 2026 and improving. Sovereign credit-rating changes in 2025 ran two-to-one positive versus negative.
When the global benchmark for fiscal sustainability is "developed-world debt unsustainability", the emerging markets that did austerity in 2014–2024 are reaping the credit-quality dividend now. The reserve currency's fiscal failure becomes a tax on countries that did nothing wrong, transmitted through dollar-funding markets and EM currency stress regardless of EM fundamentals. From here, the question is not "how do I survive a US fiscal reset?" but "what does it look like when the country that issues the unit of account becomes the worst credit in the developed world, and the country I live in becomes a comparatively better one?"
What I think actually happens
The watch-window prediction the Introduction commits to is 2026–2027. This section names the regime that prediction operates inside, and the indicators the dashboard in Essay 13 reads in real time. The contract is the dashboard's: if these indicators fail to fire inside the window, the bear case is wrong, and the manuscript is on the record saying so.
The regime, as of April 2026: slow-rolling fiscal dominance, contested central-bank independence, asset bubbles that decline to crash on schedule, demographically-locked entitlement promises that resolve by statutory cut rather than political action, structural EM divergence from DM, a dollar whose share is declining on a multi-decade arc but whose plumbing is being entrenched by stablecoin legislation, a labour-market displacement that is local and concentrated rather than aggregate-visible, a household balance sheet so thin that the political response space to any of this is dramatically narrowed, and a private-credit complex whose stress is hidden by amend-and-extend and whose end-buyer is increasingly an annuity holder. The world keeps working. The math keeps not working. The two coexist — until the indicators below close the gap.
The indicators the dashboard tests inside the watch window:
- Foreign demand at Treasury auctions. Bid-to-cover ratios, indirect bid share, basis-trade unwind.
- Federal Reserve Board composition. Whether Warsh is confirmed; whether Powell remains on the Board through political pressure; whether the inflation-fighting credibility premium in Treasury yields fades.
- Anthropic's pending round. A close at $900 billion would be the cleanest signal that private-market AI valuations have reached terminal-stage dot-com analogues.
- Hyperscaler Q2 2026 earnings. Whether the $725 billion 2026 capex guidance holds, whether AI revenue growth keeps up.
- OASI / HI legislation. Any Congressional movement on entitlement reform in the next eighteen months.
- Regional bank failures. NYCB is the watch-list name.
- A second redemption squeeze in semi-liquid private credit. If one of the major sponsors gates a fund, that is the moment the institutional cascade goes price-relevant.
- The 2026 Trustees Report. Likely to formally adopt 2032 as the OASI depletion date.
- The labour-market narrative consolidating. If the Q2 2026 BLS data shows the Brynjolfsson 13% finding holding among 22–25 year-olds, the displacement story breaks into the political mainstream.
Several independent macro voices — Gromen, Howell, Lyn Alden, Tudor Jones, Pomboy, Zulauf — converge on 2026–2027 as the watch window. That convergence is corroboration, not authority. The manuscript treats 2026–2027 as the falsifiable prediction the dashboard tests in real time. The contract is the dashboard's, not theirs.
What survives, and what I refuse to claim
Gold and silver are not insurance against the apocalypse. They are votes on fiscal credibility, and they will continue to be bid for as long as the credibility deficit persists. I hold both — the position is intended to look stupid in good periods and indispensable in stressed ones.
Bitcoin has proven itself a high-beta macro asset rather than digital gold. It survived the AI correction and the Iran shock and did not moonshot. The institutional infrastructure is real and useful. The hyperinflation narrative on which much of the BTC thesis was built has not played out in the form it was framed. BTC is a rotating macro position now, not an exit door.
Stablecoins are the use case crypto was always supposed to deliver. They are infrastructure, they are growing, and they are now wired into US fiscal plumbing. For a US reader the relevance is fiscal: foreign central banks are reducing Treasury holdings and stablecoin issuers are picking up the slack.
The L1 token complex is, as I argued in The Uncomfortable Truth, in structural decline. The asset class is consolidating around BTC, ETH, and stablecoins.
Emerging-market sovereign credit is, for the first time in my career, a structurally favourable comparison. The frame I take from this is not "buy EM" — it is stop assuming the centre is the safe place and the periphery is the risky place.
Building businesses that are productive in real terms is the part of the answer I find most boring and most correct. Productive cash flow on real services has fewer attack surfaces than levered exposure to assets whose values are tied to a sovereign credit that is deteriorating. I run a business doing exactly this. The private incentives that make it viable are the same incentives that make the aggregate displacement inevitable. That is a tension I have not resolved.
The bear regime described above is the watch-window claim, not the long-arc claim — the long-arc capability expansion of the human enterprise, which The Case for Optimism closes the manuscript on, is real, structural, and operates at a different time-horizon. The right analytical posture is to commit to the regime, commit to the watch window the indicators above test, and let the dashboard rule on whether the commitment was right. The math doesn't work — that much is structural — and the calendar inside 2026–2027 is what the dashboard, not the author, has the standing to read.
The math is the math. The timing is the question.
Footnotes
-
Fortune, March 2026 — CBO on $2T deficit hit from SCOTUS IEEPA ruling. ↩
-
One Big Beautiful Bill Act, signed July 4 2025; CBO scoring +$4.1–4.2T cumulative deficits FY2026–2034; SSA chief actuary certification (August 2025) advanced OASI depletion to 2032. ↩
-
Federal Reserve SHED 2024 — Economic Well-Being of US Households. ↩
-
The College Investor — $180B in Federal Student Loan Default (December 2025). ↩
-
Fortune — Moody's Analytics top-10% spending share (Sep 2025). ↩
-
Motley Fool — Magnificent Seven S&P 500 Tracker (April 14 2026). ↩
-
Leopold Aschenbrenner, Situational Awareness: The Decade Ahead (June 2024), pp. 75, 141–142. Section IV, "The Project," articulates the trillion-dollar federal-appropriation forecast and the timeline (27/28). ↩
-
Hatzius via Tom's Hardware — "AI added basically zero to U.S. GDP in 2025". ↩
-
Brynjolfsson, Chandar, Chen — Canaries in the Coal Mine (Stanford Digital Economy Lab, Aug 2025). ↩
-
Goldman Sachs / Elsie Peng (April 2026) — AI cutting 16,000 jobs/month, via Fortune. ↩
-
Pragmatic Engineer — Software engineering job postings five-year low. ↩
-
Bloomberg — AI and a frozen job market leave college grads underemployed (April 2026); recent-graduate unemployment Q4 2025 (NACE / NY Fed underemployment data). ↩
-
Chamath Palihapitiya — Deep Dive: Is AI Disrupting the Future of Work? (Substack, January 2026). ↩
-
CoreWeave — $8.5B DDTL 4.0 facility press release (March 2026). ↩
-
Bloomberg — Apollo and Wall Street private equity bet on America's life insurance. ↩
-
SSA Trustees Report 2025, Table IV.A1 — Cost and Income Rates. Combined OASDI program cash-flow deficits since 2021; widening through 2032. Scheduled-vs-payable gap at depletion estimated by CRFB and CBO. ↩
-
GAO — The Nation's Fiscal Health: 2024; Kotlikoff, Laurence J., "America's Fiscal Insolvency and Its Generational Consequences" (running estimates published at kotlikoff.net). ↩
-
Treasury Financial Report of the United States Government, FY2024 — Statement of Long-Term Fiscal Projections. ↩
-
SSA Trustees Report 2025 — Summary Tables, 75-Year Actuarial Balance. ↩
-
SSA Trustees Report 2025, Appendix F — Infinite Horizon Projections. Open-group unfunded obligation under intermediate assumptions. ↩
-
CBO Long-Term Outlook for Major Federal Health Care Programs. ↩
-
OPM Civil Service Retirement and Disability Fund — Annual Report. ↩
-
International Bar Association — DOJ independence assessment. ↩
-
Alliance for Lifetime Income — Peak 65 Zone Analysis; Census Bureau 2023 National Population Projections. ↩
-
Federal Reserve Distributional Financial Accounts; IndexBox 2025 estimates $88.5T Boomer wealth; Motley Fool/DFA derived 54% equity share. ↩
-
Richmond Fed Economic Brief 26-05 — BNPL: Recent Developments and Implications (Feb 2026). ↩
-
Proskauer 2025 Private Credit Restructuring Year in Review. ↩
-
Fortune — Jamie Dimon's "cockroach" warning on private credit (October 2025). ↩
-
Fortune — $265B private credit market cap erased (March 2026). ↩