The Survival Framework
In 60 seconds
Defensive posture for the watch window: zero long-duration nominal bonds; gold 10–25%; deep OTM equity puts 0.5–3% (geometric-compounding-positive); underweight Mag 7 / cap-weighted S&P; short-duration credit and T-bills; productive cash flow on real-service businesses. Tobin's Q is above 1.5; historical accumulation entry is below 0.3. Calibrated defence is not permabear positioning — it is recognising that the consensus has priced an unrealistically optimistic forward path.
The diagnostic phase is complete.
Twelve essays have documented the regime — sovereign-fiscal arithmetic that does not balance, equity valuations that have never produced positive real returns over the subsequent decade from current starting levels, demographic tailwinds reversed into headwinds, mega-cap concentration at modern-history extremes, AI capex outrunning any productivity arithmetic that can credibly justify it, energy infrastructure unable to substitute on the schedule the hyperscalers require, a political system that cannot reform before crisis forces the question, a phase-transition mechanism whose four-year co-movement signature is now in place, and a set of cracks mechanically scheduled to widen across the same 2026–2027 window. The convergent-fragility analysis closed on the question this essay opens with: the question is no longer when this breaks — it is how to position before it does.
This essay is the portfolio-construction response. It is not a prediction. It is a posture.
I. The Question — What the Manuscript Has Earned the Right to Ask
The question is not what stocks should I buy. It is not when does this break. It is not should I be in cash. Each is malformed.
The question is what posture a portfolio takes when the regime is identifiable but the date is not — when the math is decisive and the timing is contingent on mechanical clocks whose specific resolution sequence is unknowable in advance.
The forward-return math at the current multiple, the demographic-reversal math, the fiscal-arithmetic math, the convergent-fragility math — these are the math. The watch-window timing — Howell's global-liquidity peak in early 2026, the $40T refinancing wall across 2026–2028, the AI capex peak window, BOJ normalisation, the maturity calendar for 2009–2011 zero-rate-era issuance now coming due — is the question.1
The distinction matters because the regime has changed what kind of problem an investor is solving. For most of the post-2008 era, the problem was temporal — when does the next leg of the rally arrive — and the structural backstop was not in question. That is a "When" market. The current configuration is an "If" market. A 23× forward multiple embeds a structural assumption: that sovereign arithmetic, currency stability, and the mechanical-bid continuation resolve without forcing a repricing event. None of those are scheduled to resolve. The investor is now optimising across regime states, not across time to resolution. This is why what follows is architecture, not timing.
You can't predict. You can prepare.2 Specific-event prediction is futile; cycle-position identification is essential. The current cycle position — high valuations, low forward returns, risk-seeking sentiment at extremes, a mechanically scheduled refinancing wall, an asymmetric monetary-policy regime — is identifiable now, in May 2026, without claiming to know the specific date.
The discipline that holds the architecture together is the time-horizon distinction The Case for Optimism establishes. The bear regime applies to the watch window. The optimism applies to the multi-decade arc — through different mechanisms, on a different object: the human capability stock rather than the financial-institutional architecture. The discipline is hold both. In Survival, the discipline is the opposite of "pick one". Confusing the watch-window posture for the multi-decade posture is the final form of the trap.
Four analytical mechanisms underwrite the architecture that follows: the forward-return math at 23×; the geometric-return resolution of the cost-of-carry paradox; the financial-repression historical analogue; the deleveraging anatomy. Each is independently derivable. Each produces, on its own, a converging instruction. The convergence is the argument.
II. The Forward-Return Math — Why "Buy and Hold the Index" Stops Working at 23×
Start with the empirical anchor. Howard Marks's Calculus of Value (Oaktree memo, August 14, 2025) puts the relationship in a sentence that does not need to be paraphrased:3
"If you bought the S&P 500 index at 23 times the coming year's earnings per share in the period 1987–2014 (the only period for which there's data on forward-looking p/e ratios and resulting ten-year returns), your average annual return over the subsequent ten years was between plus 2% and minus 2% every time."
That is the spine of the case for defensive positioning right now — not as forecast, but as historical record. The forward-looking P/E at the end of 2024 sat at approximately 23, significantly above its historical average, and has not retreated. The cap-weighted S&P 500 today is the starting condition the historical record has priced. Across every prior instance, the next decade produced essentially nothing in real terms.
The implication for portfolio architecture is operational. Reduce concentration in high-multiple equities — specifically the mega-cap concentration in the Mag 7 names at 40%+ of S&P 500 by weight, given the consumer-revenue concentration The AI Reckoning documented.4 Increase allocation to credit instruments with reasonable spread, secured debt, and short-duration instruments. Maintain adequate liquidity for opportunistic deployment when the dislocation arrives.
The most resilient counter to defensive positioning is the conviction that bonds will rally in deflation; you need them for the deflation tail. That counter assumes the regime that produced the prior four decades' bond rallies is intact. It is not. The two structural tailwinds that underwrote the post-1980 60/40 portfolio — declining real rates and an expanding labour supply through demographic tailwind — are both reversed. The deflation-bond trade of 1981–2007 worked because starting yields were high and real rates were positive. The 2020–2026 starting point is the inverse. The next section develops the historical analogue that replaces the bond-ballast role with the opposite posture.
The mechanical-bid framing is load-bearing here. The forward-return math has been right since 2017 — and the timing has been wrong, because the mechanical bid extended the rally beyond what the fundamentals could support. Boomer 401(k) accumulation built the mechanical bid; RMD-driven decumulation across 2026–2027 reverses it. Survival positions for the mechanical reversal at the allocation level.
The honest counter is that the defensive call has not paid since 2022. Equities rallied 50%+ through 2024–2025 before any meaningful correction. Cycle positioning is not cycle timing. An investor who went defensive in late 2022 and rebalanced into the rally at higher valuations is now positioned defensively at even lower forward returns — which is precisely the time the framework applies most stringently. Full counter-engagement below.
III. The Cost-of-Carry Resolution — Convexity Is Geometric, Not Substitutive
Given the forward-return math is decisively negative at 23×, the natural reader question is: what do you do with that? The reflex answer — reduce equity exposure, hold cash, wait for better entry — has its own arithmetic problem. Cash held through equity rallies has its own opportunity cost; the rally we missed in 2023–2024 is the real version. Pure cash positioning also fails the financial-repression test developed below.
The framework that resolves the dilemma is not portfolio-class. It is mathematical, and it turns on a distinction the conventional cost-of-carry literature has misread for thirty years.
The only return that matters is geometric, not arithmetic. Spitznagel's framework reduces to that point. The distinction is not academic. A portfolio with +3.3% arithmetic returns can produce −1.5% geometric returns under the right (or wrong) drawdown profile. Volatility destroys long-term wealth even when expected values are positive — because the 50%-down-50%-up sequence is not a wash; it is a 25% loss. A single 50% drawdown requires a 100% subsequent gain to recover. A 30% drawdown requires a 43% gain. This is the geometric-vs-arithmetic distinction. It is the resolution of the cost-of-carry paradox that has frozen institutional capital from hedging since the 1990s.
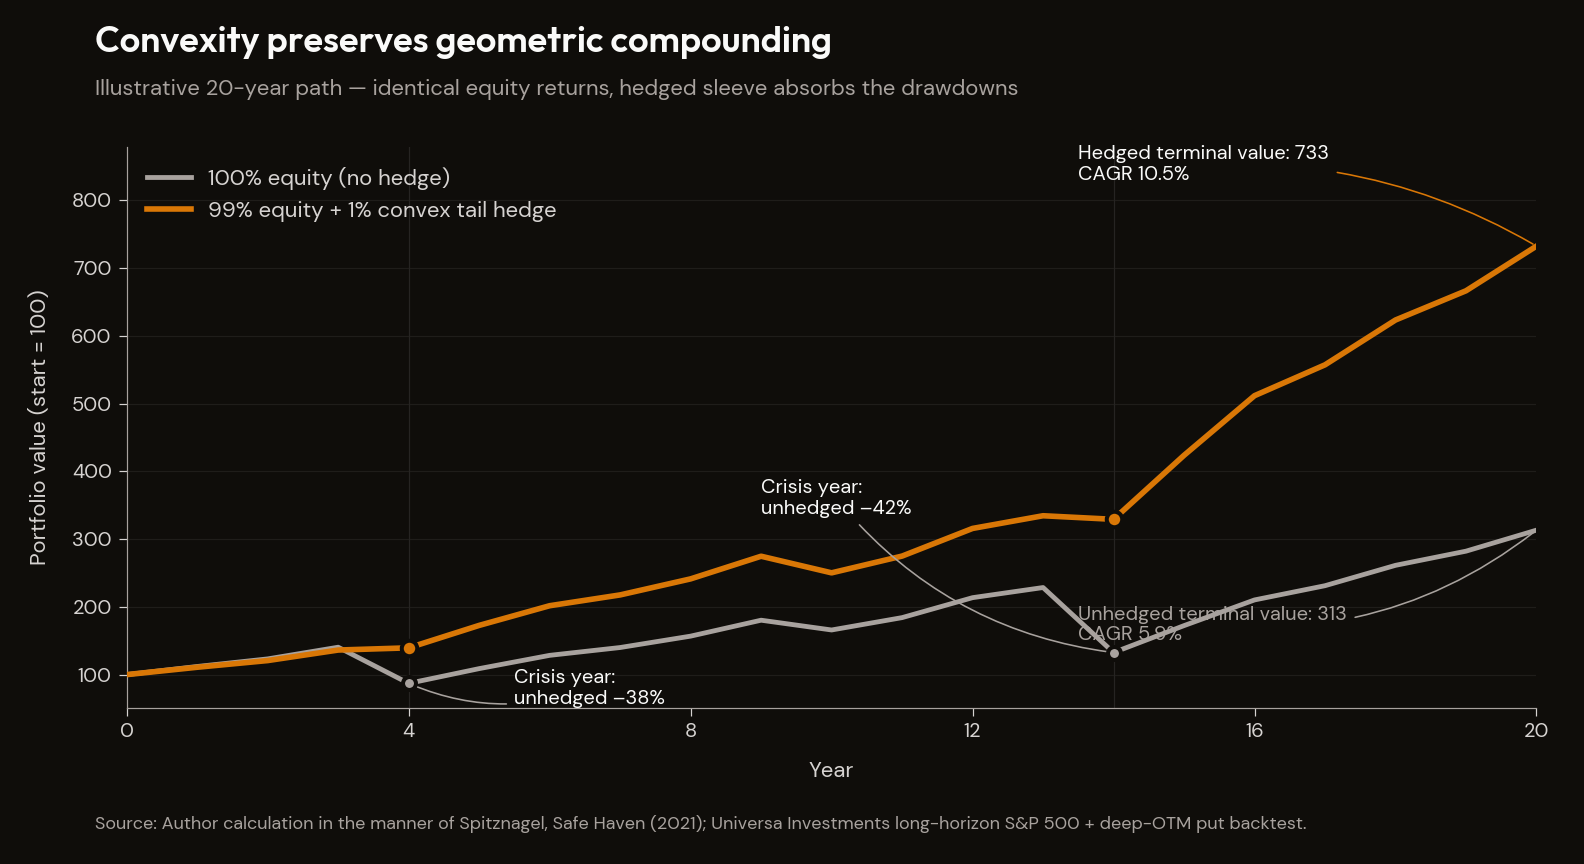
Over 120 years of S&P 500 data, a 99.5% S&P 500 / 0.5% deep out-of-the-money put-option allocation produces a superior compound annual growth rate to the S&P 500 alone — the canonical illustration anchored in Spitznagel's Safe Haven.5 The mechanics: the small annual cost of the puts — theta decay, the 0.5% premium — is more than offset across the full period by the geometric preservation during the periodic 20–50% drawdowns equity markets produce every six to ten years. The "decay is a tax" framing is wrong because the decay is arithmetic and the protection is geometric. They are not the same accounting unit. Treating them as the same accounting unit is the analytical error the convexity framework corrects.
The argument generalises. The "defensive core + small convex tail" barbell is the practical implementation, and the key point is structural: addition not substitution applies at the allocation level. The convex tail-hedge tranche adds convexity to the equity exposure; it does not substitute for it. Tail hedging is not a bet against equities. It is the mathematical mechanism by which long-run equity compounding is preserved across the drawdowns equity markets produce.
Underneath sits the fragility mechanism. h″(x) < 0 — the second derivative of harm with respect to stress — explains why the system the convex instruments hedge against breaks the way it does. Orthodox risk frameworks read the first derivative and produce a strengthening case for stability; the fragility lens reads the second derivative and produces a strengthening case for non-linear breakage. Bar-Yam's four-year rising co-movement signal pre-2008 was the empirical out-of-sample test.
The current configuration is, in framework terms, the last rational window in which to deploy hedges before volatility and hedging costs spike. Hedging when premiums are cheap and the regime has not yet broken is operationally sound; hedging after the break is too late.
One paragraph on the moral register, because it earns the inclusion. Spitznagel, in Fortune, April 7, 2024:6
"There's something immoral, just very simply, about public debt—that individuals can take on debt for their own benefit to be paid for by people who had no say in that debt."
That is the line in which the framework carries the intergenerational consequence the rest of this section treats analytically — Spitznagel elsewhere in the same Fortune piece frames it as irresponsibility to future generations who played no part in the borrowing yet bear the burden. The discipline is to use the verbatim moral register once and not let it tip the essay into permabear voice. The math is independent of the ethics; the ethics are a separate, parallel consequence.
The argument is that convexity is mathematically additive, not substitutive; that the cost-of-carry paradox is a misreading of the accounting unit; and that the geometric-return preservation is empirically demonstrated across the longest available historical record. Counter-arguments are addressed below.
IV. Why Nominal Bonds Are Not the Hedge — The Financial-Repression Analogue
The next architectural question is what replaces the long-duration nominal-bond allocation that has historically been the ballast of a balanced portfolio.
The answer is unambiguous. Zero long-duration nominal bonds. It is the rarest convergence in the manuscript and the cleanest portfolio-level instruction.
The diagnosis is structural, not cyclical. The world is in a period of financial repression — government-imposed suppression of real returns on savings, by policy design, deployed because at G7 debt-to-GDP levels in the 230–380% range there is no credible policy path other than repression, default, or genuine austerity. Default and austerity are politically unavailable in democracies under the political-amplifier diagnosis; the V-Dem Liberal Democracy Index in 2026 fell 24% in a year, with 25% of nations backsliding.7 The political ground that makes austerity or default thinkable has thinned, not thickened. Repression is the residual outcome.
The mechanism does not require explicit capital controls in 1950s style. It requires only continued central-bank willingness to hold yields below inflation, regulatory requirements for large institutional savers (pension funds, insurance companies, banks) to maintain government-bond allocations, and political consensus that defaulting or cutting spending is unacceptable. All three currently exist.
The historical analogue is precise. From 1939 to 1979, US Treasury yields were largely decoupled from inflation: positive nominal returns coexisted with deeply negative real returns for forty years. Russell Napier's framing on the period is the cleanest available: in financial repression, government bonds become what hard-money commentators of the 1970s called certificates of confiscation.8 The bondholder receives the contractual coupon and is repaid the contractual principal. The bondholder also loses purchasing power, deliberately, every year, by policy design. The accounting records a positive nominal return; the lived experience of the position is a transfer from the saver to the sovereign. The transfer is the purpose of the policy, not its side-effect. The mechanism is the mathematical inverse of the post-1980 four-decade bull market in bonds: that period worked because real rates were positive; financial repression works for the issuer because real rates are negative.
The empirical confirmation is Japan. The demographic-curve analysis upstream did the work, and this section references that spine without re-spinning it. Real residential property prices remain −35.9% below the Q1 1991 peak after thirty-four years;9 the BOJ owns approximately 49% of all JGBs outstanding; its balance sheet sits at 99–101% of nominal GDP; the policy regime ran zero rates, negative rates, yield curve control, and QE at unprecedented scale.10 The asset-price implication did not reverse. Japan is the developed-economy demographic curve running ten to twenty years ahead of the rest of the developed world. The US is on the same curve, just earlier, and masked by immigration whose political cost is now mounting. Japan is not analogue; it is preview.
The portfolio directive follows directly. Zero long-duration nominal government bonds, structurally, not tactically. Minimal cap-weighted index concentration on US equities, which face headwinds from fiscal dominance and dollar devaluation. Equity allocation rotates to sectors with real-asset optionality: energy, defence, precious-metals equities, alternative-energy infrastructure. The energy-bottleneck data is direct: the NERC +69% / +224 GW demand revision11 and the PJM auction at the FERC cap of $329.17/MW-day (roughly eleven times the 2024 clearing price)12 are the empirical signatures of a binding physical constraint that capital has not yet repriced. Gold runs at 10–25% of the portfolio as a store of value outside the fiat system. Selected emerging-market equities chosen on demographic and institutional-quality criteria are the final layer — not China, which faces its own repression. Setser's 70% of EM external sovereign debt remaining USD-denominated is the de-dollarisation ceiling,13 and the JSE-Top-40-earns-offshore observation extends the institutional-quality-not-geography test to the African case.
The historical-precedent anchor on entry timing matters because it scopes what opportunity looks like. The four major US equity-market bottoms — August 1921, July 1932, June 1949, August 1982 — all required compression to roughly 0.3 on Tobin's Q. Today's reading is well above 1.5. The implication is not that an immediate correction will produce a 70% drawdown; it is that when correction does come, the historical base case for a generational entry point is a 70%+ discount to replacement value. Survival's territory is the dry-powder discipline that makes the eventual deployment possible.
Hunt's monetary-policy asymmetry reinforces the bond-ballast verdict. In over-indebted conditions, Hunt argues, monetary policy becomes asymmetric: tightening still bites, but loosening pushes on a string as velocity collapses.14 The bond rally that conventional balanced-portfolio theory expects in deflation requires the Fed to engineer reflation; in over-indebted economies, the policy tool has lost traction. The deflation-bond hedge requires the engine that no longer turns over.
The honest counter is direct: real yields turned positive in 2023–2024 — Fed tightening plus market repricing — making bonds less clearly repressed in the near term. The response is the regime-vs-timing distinction. Once growth slows, the Fed will be forced to cut rates again, real yields will turn negative, and bonds will re-enter the repression zone.
V. The Anatomy of a Deleveraging — How the Resolution Actually Unfolds
The prior three sections describe the architecture: defensive equity tilt, convex tail, no nominal bond ballast. This section describes the mechanism the architecture is a response to. Knowing the mechanism is what allows the architecture to be held when the resolution begins.
The deleveraging dilemma reduces to four options. When debt is unsustainable relative to income, the policy choice set is austerity (cut spending), default (don't pay), inflation (reduce real value of debt), and wealth redistribution (tax/confiscate). There is no escape: governments choose one of the four levers, and in practice they typically deploy some combination of all of them. That is Ray Dalio's distillation in Principles for Navigating Big Debt Crises (Bridgewater / Simon & Schuster, 2018), built on the most comprehensive cross-country longitudinal dataset of debt-crisis resolutions in the academic record.15 The taxonomy matches the financial-repression diagnosis at the macro level: austerity and default are politically unavailable; inflation and wealth redistribution are the residual outcomes. Inflation is the financial-repression channel; wealth redistribution is the mechanism the political-amplifier movement engaged at the political level. Same diagnostic mechanism, different framings.
The fiscal arithmetic in flow-rate terms makes the abstraction operational. US federal spending runs approximately $7 trillion annually against revenue of roughly $5.2 trillion — a deficit of $1.8 trillion. Net interest payments are running at $22–23 billion per week in Q1 FY 2026.16 Compounded — "like plaque building up in an artery" — those weekly interest payments are the Ferguson's Law breach expressed in operational rate-per-week terms.17 The flow-rate framing converts the abstract debt-stock argument into a velocity argument that is harder to dismiss. Net interest is now the largest single category of federal spending after Social Security and Medicare. The arithmetic is mechanical; it is also accelerating.
The mechanism by which the abstract debt-stock problem becomes a forced-choice event is the debt death spiral: debt grows faster than income → debt service rises → fiscal drag compresses growth → tax revenue falls → deficit widens → market participants demand higher yields → yields accelerate the deleveraging need → eventually holders refuse to roll over → forced choice. That is the $40T refinancing wall plus the Ferguson's Law breach plus the historical-empire endpoint, expressed as a single mechanical chain. Hunt's monetary-policy asymmetry is the structural backstop: the Fed can still tighten, but it cannot reflate. The death spiral is the mechanism through which Hunt's asymmetry becomes binding.
The portfolio implication ties this section to the prior three. Debt is money, and money is debt. What I mean is debt is a promise to receive somebody else's money. Devaluing money devalues debt — Dalio's April 2026 LinkedIn framing.18 If the dollar is devalued — which the big-debt-cycle taxonomy treats as structurally inevitable on the current trajectory — all dollar-denominated debt loses real value, but all dollar-denominated savings also lose real value. The only assets that preserve value are real assets (equities with earnings power, real estate, commodities), non-fiat stores of value (gold, with crypto as a smaller adjunct), and selected foreign-currency assets in jurisdictions with structurally better fiscal positions. The institutional-quality axis is the discriminator.
The five-converging-crises framing operationalises the watch-window timing. Domestic political conflict and wealth inequality at the largest disparities in 100+ years; international rivalries (US-China AI/semiconductor/military tensions); climate-driven disruptions; AI destabilisation (capex requirements competing with fiscal obligations — Acemoglu's 0.66% TFP ceiling19 against the $725B 2026 capex projection20); and the national debt crisis itself. Dalio's May 2026 Fortune piece frames the five forces as already converging — not a 2030 risk to model, but a 2026–27 condition to navigate.21 The convergence with Howell, Gromen, Alden, Pomboy, and Tudor Jones across the prior fifteen essays is the analytical fact.
The All-Weather template — 30% equities, 55% long-duration bonds, 15% hard assets — is, in this regime, obsolete.22 The model portfolio below replaces it: gold at 10–15% (up from the historical 7.5%); cryptocurrency at 1–5% with the stablecoin-colonisation caveat on GENIUS Act dynamics; reduced long-duration nominal bond exposure with short-duration instruments preferred; selected emerging-market and non-USD equity exposure on the institutional-quality axis. The objective is not to lower returns — it is the deleveraging-resistant architecture the four mechanisms converge on.
VI. The Synthesis — Four Mechanisms, One Architecture, One Discipline
The architecture is barbelled. The defensive core: quality equities selected on real-asset optionality and institutional-quality criteria, underweighted in mega-cap concentration relative to the cap-weighted index; gold at 10–25% calibrated by individual circumstance and currency-base; the convex-tail tranche in the 0.5–3% allocation range; cash held in short-duration high-quality credit and T-bills. Long-duration nominal government bonds at zero by directional preference. The convex tactical exposure (the second leg of the barbell) is largely Opportunity's territory; Survival's job is to build the architecture that lets it be deployed when the dislocation arrives.
The discipline is hold both — the bear regime now and the long-arc optimism on the multi-decade arc that The Case for Optimism establishes. The portfolio is constructed for the watch window. The optimism is not retracted; it is held alongside, on a different time horizon, on a different object — the human capability stock rather than the financial-institutional architecture. The bear regime applies to the watch window. The optimism applies to the multi-decade arc. Position accordingly — and do not mistake the distinction for comfort.
The four mechanisms are independent in derivation and convergent in conclusion. The forward-return math reads the cycle position from the historical record of starting-multiple outcomes — at 23×, the next decade produces +2% to −2% real — and concludes reduced equity concentration. The geometric-return calculus reads the volatility-and-compounding mathematics and concludes convex tail-hedge allocation that adds convexity rather than substituting for equity exposure. The financial-repression analogue reads the 1939–1979 record plus the completed Japan case and concludes zero or near-zero long-duration nominal bonds. The big-debt-cycle taxonomy reads the cross-country longitudinal record and concludes real-asset allocation, raised gold weighting, currency diversification on an institutional-quality axis. Four derivations, one architecture. That convergence is the argument.
The portfolio architecture is built on the math. The implementation calibration is informed by the timing. The discipline is to hold both.
There is no neutral passive position in 2026. The cap-weighted S&P 500, with 40%+ of weight concentrated in ten consumer-AI-dependent mega-cap names trading at 23× forward earnings, is itself a concentrated bet on the consumer-AI complex. The consumer-revenue concentration is the load-bearing fact The AI Reckoning established. Being passive is being long the consumer-AI infrastructure thesis at extreme valuations, with the demographic curve inverting on the same calendar. Underweighting the index relative to a regime-calibrated allocation is itself a defensive move.
The model portfolio below is the prescription. It commits to specific midpoints rather than waving at ranges — directional preferences and operational weights together. Individual circumstances will push the midpoints, but the prescription is the commitment, not the hedge.
The model portfolio
Illustrative, not personalised advice — the standard legal hedge applies. The point of stating specific midpoints rather than ranges is to commit to the architecture in a form a reader can argue against, deploy from, or override on individual circumstances. The midpoints are the manuscript's position; the override is the reader's.
| Asset class | Allocation | Role | Instrument examples |
|---|---|---|---|
| Quality equities, real-asset earnings tilt | 40% | Long-arc capture; productive cash flow with limited fiscal-flow dependency | Defensive global equity ETF; energy, defence, precious-metals equities, alt-energy infrastructure |
| Short-duration high-quality credit & T-bills | 35% | Yield, dry powder, optionality on opportunity rotations | 1–3y Treasury ETFs; high-quality short-corporate |
| Gold & precious-metals equities | 15% | Fiscal-credibility arbitrage; insurance against monetary regime change | Allocated physical / GLD-equivalent / GDX |
| Silver | 3% | Structural deficit + industrial optionality; smaller position because more volatile | Allocated physical / SLV-equivalent |
| Productive cash (business reinvestment) | 3% | Real-economy compounding outside the financial-asset regime | Owner-operator capital |
| Bitcoin | 2% | Fiscal-dominance tail hedge; not "digital gold" | Spot ETF or self-custody |
| Deep OTM equity index puts | 2% | Convex tail-hedge; sized to lift CAGR via geometric compounding | 6–12 month, ~20–30% OTM SPX puts, rolled |
| Long-duration nominal sovereign bonds | 0% | None — the manuscript's argument is structural | — |
Tobin's Q reference: historical accumulation entry points have been Tobin's Q below ~0.3. Current reading is above 1.5. The 60% defensive weight in this table is calibrated against current Q, not historical accumulation Q.
How the portfolio behaves across resolution paths
| Scenario | Asset performance (12–24m) | Portfolio behaviour | Rebalancing trigger |
|---|---|---|---|
| Slow grind (1966–82 analogue): regime persists; sideways nominal grind; real-asset rotation | Equities flat-to-down nominally; gold up; credit positive yield | Long-arc core captures yield; gold/silver re-rate; cash earns positive real | If equity multiple compresses ≥20% w/ EPS holding: rotate cash into quality-equity core |
| Sharp resolution (2000-style + 2008-style): equity drawdown 30–50%; credit cascade; gold spike | Equities -30 to -50%; gold +25 to +50%; defensive sleeve outperforms; OTM puts pay | Cash deployed at lower multiples; gold trimmed at extremes; puts realised | Equity index −25% from current: deploy 25% of cash; −40%: deploy 50%; −50%: deploy 75% |
| Inflation-led resolution: dollar depreciation; nominal asset rally; real-asset compression | Nominal equities flat-to-up but real negative; gold up; credit suffers in long-end; consumer staples real-negative | Gold/silver outperform; equities-real-asset tilt outperforms broad equity; bonds zero-weight pays | Realised CPI sustained >5% for 2 quarters: trim 5pp from short-credit into commodity-producers |
| Bull continuation (regime persists, hostile-reviewer wins): Mag 7 continues; long-arc dominates | Equities up 15–25%; gold flat; credit positive yield; defensive sleeve underperforms | Quality core captures; defensive sleeve drags on relative return | Mag 7 EPS revisions +25% sustained AND multiples hold: rotate 5–10pp from defensive sleeve into core |
The directional preferences are the load-bearing claim; the weights are the operational commitment a reader can argue against rather than a flinch into "it depends".
VII. Honest Counter-Arguments — Six, Engaged at Strongest Version
A discipline-respecting essay engages its best counter-arguments. Six, in the body, at strongest version.
1. Tail hedging is decay; geometric-mean preservation is statistical arbitrage at best.
The objection: put options bleed theta when volatility is low; a 0.5% annual cost compounds to material drag across decades; the 120-year backtest benefits from cherry-picked endpoints. The response is internal to the convexity framework itself: the decay is arithmetic cost, not geometric cost. The geometric preservation during a 50% drawdown — which equity markets have produced multiple times in the historical record (1929, 1973, 1987, 2000, 2008, 2020) — prevents the sequential compounding destruction that takes 20+ years to recover from. Across realistic time horizons of 20–50 years, the arithmetic cost is worth less than the geometric benefit of preventing a 50% sequential loss. The "statistical arbitrage" framing itself proves the point: the market systematically underprices tail risk, which is the inefficiency the framework exploits. The burden of proof is on the counter to show that the historical record does not exhibit the drawdown frequency the framework prices for. That evidence has not been produced.
2. Sixty-forty has worked; "this time is different" is always wrong.
The objection: balanced portfolios have produced reasonable real returns across most multi-decade periods; this time is different is the language that has historically preceded the worst forecasting errors. The response: the 60/40 worked because the post-1980 regime had two structural tailwinds — declining interest rates (a forty-year bull market in bonds) and demographic expansion in developed markets (Goodhart-Pradhan's doubling of the global labour supply). Both are reversed. The regime has not changed in unprecedented ways; it has changed in ways that have ample historical precedent — 1939–1979 financial repression, the four bear-bottom periods, the post-WWII deleveraging cycle. The 60/40 framework was contingent on a regime that has now ended. The counter has the burden of producing a plausible mechanism by which 60/40 produces positive real returns over the next decade given the documented starting conditions. That mechanism has not been articulated.
3. You can't predict, so don't position.
The objection: if the date is unknowable, any positioning is market-timing dressed as regime-analysis; stay invested through the cycle produces better long-run returns. You can't predict. You can prepare.2 is the direct engagement. The current cycle position — high valuations, low forward returns, risk-seeking sentiment at extremes, mechanically scheduled refinancing wall, asymmetric monetary-policy regime — is identifiable now without claiming to know the date. Stay invested through the cycle is itself a cycle-positioning claim; the question is whether it is consistent with current starting conditions. At 23× forward earnings, the historical record shows the answer: +2% to −2% real over the subsequent decade. The counter has the burden of explaining why the forward-return relationship at 23× does not apply to the next decade. That explanation has not been articulated. Regime identification is not date prediction.
4. The bears have been bearish since 2019; the call has not paid.
The objection: defensive positioning across 2019–2025 underperformed equities by 100%+; investors who held cash and gold underperformed the cap-weighted index meaningfully. The response: cycle positioning is not cycle timing. The big-debt-cycle thesis has been articulable since 2018; the cycle's resolution timing depends on the central-bank backstop's ability to extend the system, and central banks bought $7+ trillion of assets post-2008 specifically to extend it. That extension is now exhausted — Hunt's velocity collapse and Howell's $40T refinancing wall are the mechanisms by which the prior-scale extension cannot be repeated without the dollar-credibility cost the AI capex / sovereign debt forced choice identifies.1 Investors who heeded the framework and rebalanced into the rally are now defensively positioned at lower forward returns — which is precisely the time the framework recommends defensive positioning.
5. The published convex-tail returns are pre-fee or selectively timeframed.
The objection: published tail-hedge returns of 4,000%+ in March 2020 are outliers; on a full-cycle 2007–2026 basis, tail-hedging-strategy returns are modest and trail the S&P 500. The honest engagement is direct: convex tail-hedge strategies do not claim to rival the S&P 500 in bull markets. They explicitly position as insurance, not alpha generation. For an institutional investor holding 99% S&P 500 plus 1% hedge allocation, a 1-in-30-year return of 4,000%+ on the hedge tranche perfectly justifies the arithmetic drag in non-tail years. The geometric-mean preservation argument is strategy-class, not fund-specific. The counter is performative if it is fund-targeted.
6. The zero-bond directive is too aggressive; even some duration is hedge.
The objection: zero is rhetorical; some allocation to long-duration nominal bonds is defensible as a deflation-tail hedge — Hunt's framework supports this, in that if velocity collapses sufficiently, deflationary forces dominate and bonds rally. The response is Japan. The Japanese case ran the deflation experiment for thirty-four years with bonds; real returns were barely positive even at higher starting yields; the BOJ now owns 49% of all JGBs because no other domestic buyer existed at the rates the government required.10 The deflation-bond trade has historically worked when starting yields are high and real rates are positive (1981, 2007); it does not work when starting yields are low and real rates are negative (the 2020–2026 starting point in the United States, with 30-year UST real returns annualised at approximately −3.8% across 2020–2025).23 The directional preference — zero or minimal long-duration nominal bonds — is robust across all four mechanisms. The Japan case is the completed test.
The pattern across all six counters is the same: each conflates identifying the regime with calling the date, and the framework requires only the first. The framework is independent of the timing imprecision; the manuscript's contribution is the framework. The counter has been engaged at strongest version, not at strawman.
Footnotes
-
Howard Marks, You Can't Predict. You Can Prepare. (Oaktree Capital memo, November 20, 2001). ↩ ↩2
-
Howard Marks, The Calculus of Value (Oaktree Capital memo). ↩
-
Motley Fool — Magnificent Seven S&P 500 Tracker (April 14 2026). ↩
-
Fortune — "Hedge funder famous for his 'black swan' strategy says there's 'something immoral' about America's reliance on debt" (April 7, 2024). ↩
-
V-Dem Institute, Democracy Report 2026: Unraveling The Democratic Era? — press release on US decline. University of Gothenburg. United States sub-indices on judicial constraints on the executive, media freedom, and freedom of expression all moved adversely in 2025; six of ten newly autocratising countries in Europe / North America; approximately 25% of nations in active backsliding. ↩
-
Anatomy of the Bear: Lessons from Wall Street's Four Great Bottoms, Harriman House (2005). The phrase "certificates of confiscation" is associated with 1970s hard-money commentary (notably Franz Pick) and is invoked by Napier as that period's anchor framing rather than as his own coinage. ↩
-
Bank of Japan — Statistics (BOJ Accounts; Outright Purchases of JGBs). ↩ ↩2
-
PJM Reliability Pricing Model — capacity auction results portal. ↩
-
Brad Setser — Follow the Money blog, Council on Foreign Relations. ↩
-
Hoisington Investment Management — Quarterly Reviews and Outlook. Lacy Hunt's debt-disinflation framework — velocity collapse, asymmetric monetary policy, marginal-revenue-product-of-debt — is developed across Hoisington's quarterly investment-outlook publications and built on Irving Fisher's 1934 Econometrica article, "The Debt-Deflation Theory of Great Depressions." ↩
-
Principles for Navigating Big Debt Crises (Bridgewater / Simon & Schuster, 2018). ↩
-
Ray Dalio, LinkedIn — "Throughout history, all fiat currencies eventually..." (April 2026). "Debt is money, and money is debt" is the verbatim pairing; the connective "What I mean is debt is a promise to receive somebody else's money" is verbatim; the "devaluing money devalues debt" formulation is the manuscript's compression. ↩
-
Fortune — "Ray Dalio: the 'heart attack' of America's debt crisis is just the beginning of a 'great turbulence'" (May 8, 2026). ↩
-
Principles for Dealing with the Changing World Order: Why Nations Succeed and Fail (Avid Reader Press / Simon & Schuster, 2021). ↩
-
FRED — Market Yield on US Treasury Securities at 30-Year Constant Maturity, Inflation-Indexed (DFII30). ↩