The Bottleneck Map
In 60 seconds
Five sectors, audited under the Falsifiability Method, for where pricing power concentrates as the manuscript's diagnosis unfolds. Energy and the grid; materials and critical minerals; chips and the compute stack; eldercare and specialty pharma; private credit and the annuity backstop. Each sector treated under a four-part template — the arithmetic, first-order chokepoints, second-order chokepoints, what would change my read. Named primary holders. Named upstream gates. Named falsifiability thresholds. Descriptive, not predictive. The Method applied to new material. The cross-links are the audit trail.
A bottleneck is not the same thing as a fragile supply chain. The literature on supply-chain risk is the literature of single-point failure — semiconductor fabs in Taiwan, rare-earth processing in China, peptide CMOs in Switzerland — and it has been written and re-written for two decades. This is a different document. What follows asks where, given the manuscript's macro diagnosis, the spread that diagnosis implies is structurally captured rather than competed away. Books-of-account framing: who is holding the part of the income statement that everyone else has to flow through, and what mechanism — sovereign control, capital intensity, regulatory moat, network effect — makes them hold it durably?
That re-framing changes the question. Fragile describes a topology that could fail. Bottleneck, here, describes a topology that has already chosen a winner — the holder whose marginal pricing power, once measured, is the answer to who captures the spread the manuscript's diagnosis implies? The manuscript already does the diagnostic work. Federal debt approaching 100% of GDP, net interest above defence, OASI depletion in 2032 or 2033 depending on which institution is publishing, hyperscaler capex moving more than ten times faster than AI revenue, household balance sheets that cannot cover a $400 emergency, institutional trust at 17%. The diagnosis is the assumption. The Bottleneck Map asks what the assumption costs and who is on the receiving end.
This is the Method applied. The Falsifiability Method articulated the discipline as four principles — authorial position, audit discipline, structural-vs-cyclical, falsifiable description — and four refusals (no decision trees, no dated forecasts, no RAG colour-coding, no 2-by-2 framings). Every sector below carries an <AppliedHere> callout back to one of those principles. The refusals apply throughout: each sector describes who holds the chokepoint with numeric thresholds, named mechanisms, named primary sources. The reader determines posture from the description.
The mode is descriptive. The reader who wants a buy recommendation or a sell signal can find one elsewhere; the reader who wants to know whose books-of-account the diagnosis flows through, and what would have to change for the books to read differently, is the reader this document is designed for. Pricing-power concentration is observable from primary sources today. Whether the holders retain it for ten years, twenty years, or until the next regulatory wave is not the question. Whether the regulator deconstructs what the regulator constructed is a separate analysis the Method's §4b principle addresses in the closer. The question of the snapshot moment is the question this map is structured around.
Five sectors, in order. Energy and the grid first — the binding physical constraint on AI capex, electrification, data-centre cooling, electric-fleet rollout, and eldercare-facility power. The hyperscaler that cannot get a transformer, the data centre that cannot get a power contract, the off-grid generation share moving from zero to thirty percent in twenty-four months. Manuscript §3 already opens the door; the map walks through. Materials and critical minerals second — descending to the upstream sovereign-gated layer where the chemistry is harder to relocate than the mine. China processes ninety-one percent of magnet rare earths, gates gallium and germanium and rare-earth separation technology by export licence, and the calibration on what that means for the consuming bloc reads differently from a producer-country desk. Chips and the compute stack third — climbing back into the high-value-add layer downstream of materials and energy. NVIDIA, TSMC, ASML, the HBM trio, and the stack of sequential monopolies below them. Manuscript §3's capex/revenue gap and the Anthropic-round trigger anchor the arithmetic. Eldercare and specialty pharma fourth — the demographic compounding the manuscript §4 entitlement-math diagnosis sits inside. Peak 65, Medicare HI depletion at 2033 or 2040 depending on which institution publishes, the GLP-1 duopoly, the Alzheimer's anti-amyloid duopoly, the dialysis duopoly, the integrated managed-care vertical. Private credit and the annuity backstop fifth — the financial-transmission layer where the stress from the first four sectors lands and where the integrated bubble the manuscript names runs its longest arc. Hyperscaler capex into private credit into annuity end-buyer. CoreWeave, Blackstone, Apollo, Athene, Bermuda.
The structural climb is the document's argument: from concrete physical arithmetic (1–3) to demographic compounding (4) to financial transmission (5). The same climb the manuscript itself walks. The first three sectors are the integrated AI / energy / supply-chain bottleneck cluster the manuscript §3 begins to name. Sector 4 picks up the §4 entitlement math; Sector 5 picks up the §3 AI/private-credit fusion. The Bottleneck Map extends the audit into the territory the manuscript opens.
Two disclosures inherited from the Method — Cape Town vantage and displacer-as-witness — articulated in §1 of the Falsifiability Method. Neither disclosure changes the math; both should make the audit trail more honest.
What the document is not. No stock-pick recommendations. No specific calendar-keyed predictions for any holder's pricing-power retention. No promise that the named first-order companies in any sector will hold their seat indefinitely. Each sector's What would change my read clause names the numeric threshold + mechanism + primary source whose movement would revise the sector's snapshot. The audit trail extends through time as well as across sources. The map is the map. The reader determines posture.
1. Energy & the grid
The grid is the binding physical constraint on everything the manuscript's diagnosis says is happening at the same time. AI capex needs gigawatt-scale data-centre power; vehicle electrification needs transformer capacity at the substation level; electrification of industry needs HVDC backbone the existing topology was never engineered to deliver; eldercare facilities at Peak 65 occupancy compound base-load demand the regional capacity-market clearings already cannot supply. Whatever else the macro diagnosis says about consumer credit and entitlement math, the energy infrastructure has to deliver the kWh before anything downstream resolves. The pricing power sits with the operators of capacity-constrained networks and the manufacturers of capacity-constrained equipment — the topology cannot be summoned at the speed of the demand curve, and the demand curve has already turned vertical.
The arithmetic
Three numbers, each with a primary source.
The IEA's Energy and AI report (April 2025) projects global data-centre electricity consumption rising to approximately 945 TWh by 2030, exceeding Japan's entire present national electricity consumption, with AI-specific demand quadrupling over the window.1 The 2026 share of that 945 TWh is what the manuscript's grid paragraph names; the trajectory is what Electricity 2026 anchors. The number is not a forecast. It is the sum of disclosed hyperscaler 2026 capex guidance — Microsoft, Alphabet, Amazon, Meta combined at approximately $725 billion per Q1 2026 earnings — converted into the power profile the build-out requires, and it has already been mechanical in PJM's clearing prices.
PJM's Base Residual Auction cleared at $28.92/MW-day for the 2024/2025 delivery year and at $269.92/MW-day for 2025/2026 — a near-ninefold increase in twelve months. The 2026/2027 auction hit the FERC-approved price cap at $329.17/MW-day, a further twenty-two percent rise, with peak-load forecasts revised upward by over 5,400 MW driven by data-centre expansion and electrification.2 The cleared volume exceeded the reliability requirement by only 139 MW UCAP — the regional capacity-market arithmetic clearing into a thin margin a single hyperscaler announcement could compress further.
Grid interconnection timelines now stretch seven or more years in constrained regions, pushing hyperscalers toward off-grid solutions. As of early 2026, approximately thirty percent of newly planned data-centre capacity is designed around on-site generation — up from effectively zero in 2024 — with one-third of hyperscalers targeting full on-site power by 2030.3 Large power transformers averaged 128 weeks of lead time in mid-2025; generator step-up transformers (GSUs, the substation-grade units required for new hyperscaler builds) averaged 144 weeks, with some high-capacity units extending to four years.4 These numbers compound on each other. A hyperscaler that cannot get a transformer cannot get a substation; a substation that cannot be commissioned cannot connect a campus to the grid; a campus that cannot connect goes off-grid; off-grid demand bids up gas turbine and nuclear PPA capacity that was not in the supply curve. The grid is the binding constraint, and the binding works upstream.
Applied here · Manuscript essay · §3 (AI math — grid constraint)The Math Doesn't Work — grid as binding constraint
“The grid is now the binding constraint, not the capital. IEA projects global data centre electricity consumption in 2026 at roughly Japan's entire national consumption. PJM capacity prices have risen tenfold in twelve months; transformer lead times are two-to-four years; roughly 30% of newly planned capacity is designed to operate off-grid via on-site generation, up from effectively zero a year ago.”
Read →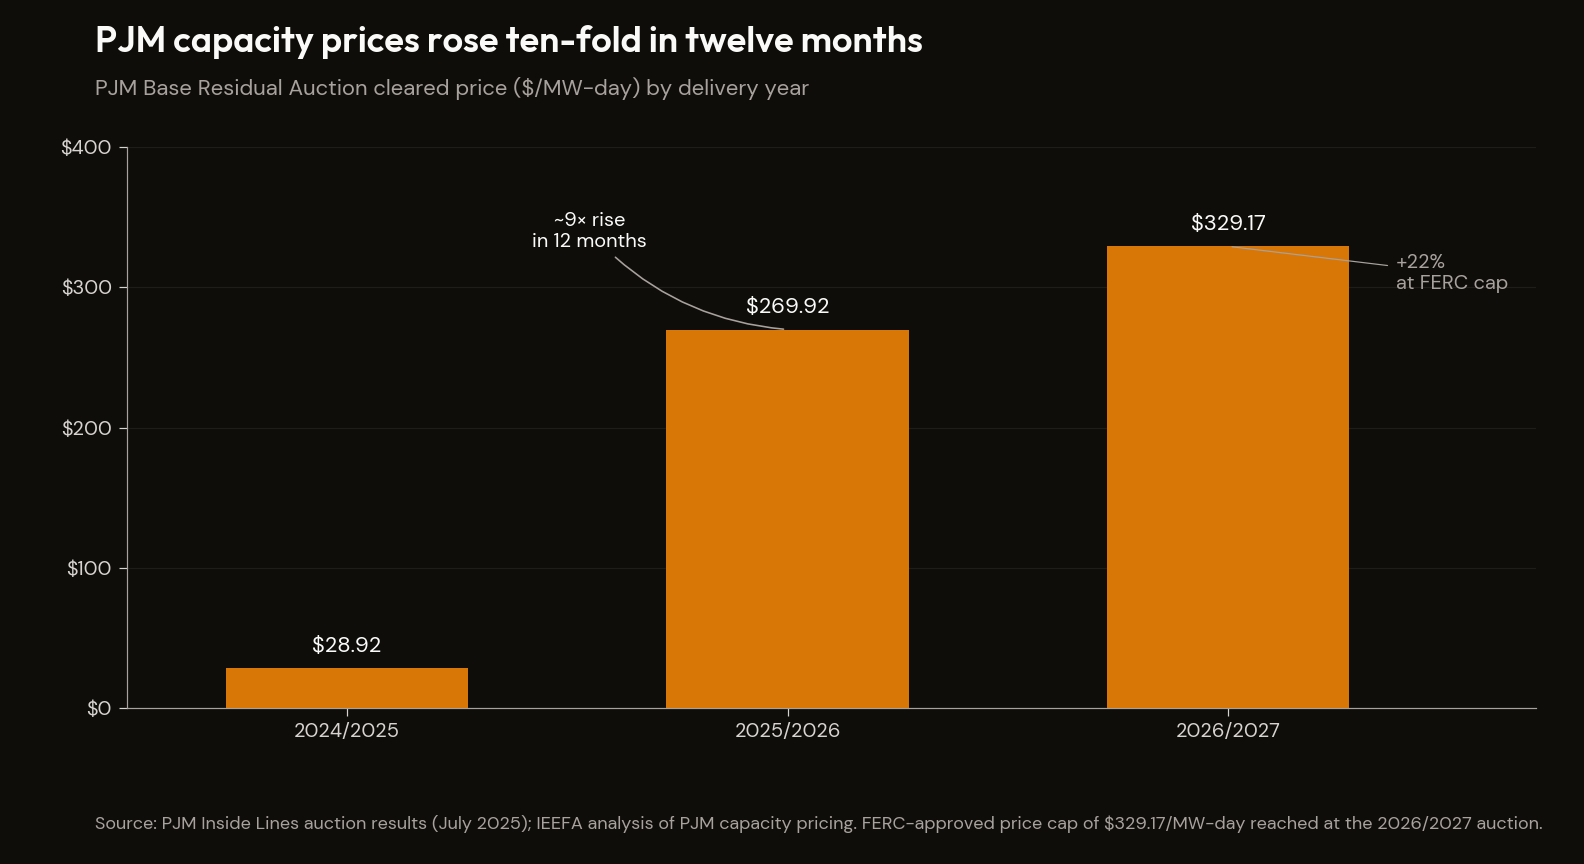
First-order chokepoints
The pricing-power-holders are the manufacturers and operators of capacity-constrained equipment, and the equipment cannot be summoned. Five entities define the layer.
GE Vernova holds the largest backlog in the heavy-duty gas turbine market — 100 GW as of Q1 2026, with delivery slots sold out through 2030 and new orders pricing ten to twenty percent above the prior-year backlog on a $/kW basis.5 CEO Scott Strazik has stated publicly that the company expects to be fully booked through 2030 by the end of 2026. The annualised production capacity sits around 20 GW; the remaining slots across 2029 and 2030 combined total roughly 10 GW. Behind-the-meter hyperscaler builds queue alongside utility orders for combined-cycle replacement on the same production line.
Siemens Energy sold 194 gas turbines in fiscal year 2025 versus 100 in fiscal year 2024 and reported a record order backlog of €138 billion.6 Lead times for new heavy-duty units now run five to seven years per S&P Global's May 2025 survey, and the €2 billion Siemens has committed to manufacturing-capacity expansion does not bring new capacity online until 2028 or later. Mitsubishi Heavy Industries is the third large-frame OEM behind GE Vernova and Siemens, completing what is closer to a tight oligopoly than a duopoly — but the practical effect for a 2026 hyperscaler order is the same: every delivery slot inside the decade is allocated.
Hitachi Energy sits at the centre of the large-power-transformer constraint, with a $1 billion investment in its South Boston plant scheduled for 2028 and generator step-up transformers averaging 144 weeks per the Wood Mackenzie Q2 2025 survey.4 Demand for GSUs has risen 274% since 2019. Hitachi Energy is one of four suppliers controlling roughly two-thirds of the US large-transformer market; Hyundai Electric and Schneider Electric round out the named layer.
Constellation Energy signed twenty-year power purchase agreements with Microsoft for the 835 MW restart of Three Mile Island Unit 1 (Crane Clean Energy Center, target 2028) and with Meta for 1,121 MW at the Clinton Clean Energy Center from June 2027. The $16.4 billion Calpine acquisition closed in March 2026 and added gas dispatch capability across the contracted clean-energy fleet of over 5,650 MW.7 The PPAs are bilateral and undisclosed in price but lock long-duration revenue at above-market spot rates and price-shield the asset from PJM clearing volatility.
Vistra Corp signed a twenty-year PPA with Meta for 2,609 MW of PJM nuclear capacity in January 2026 and cleared 10,255 MW in the 2026/2027 PJM auction at a $273.45/MW-day weighted average.8 Vistra is 100% hedged for 2026 and 84% for 2027, acquiring Cogentrix's 5.5 GW gas fleet for $4 billion to extend the dispatchable portfolio. Nuclear units inside PJM clear at or near the price cap, which is the same arithmetic from the demand side that the first-order list reads from the supply side.
On the income statement, the pricing power sits in the heavy-duty turbine gross margin line at GE Vernova and Siemens Energy (the rationing premium of being booked through 2030), the contracted-revenue line at Constellation and Vistra (PPA pricing locked above PJM clearing), and the transformer-pricing differential at Hitachi Energy (eighty percent over five years). Capital-intensity and sovereign moats hold each line.
| Holder | Position | Key metric | Mechanism |
|---|---|---|---|
| GE Vernova | Largest heavy-duty gas turbine backlog | 100 GW (Q1 2026); sold out through 2030 | Production capacity vs demand; new orders price 10–20% above prior-year backlog |
| Siemens Energy | Second large-frame OEM | €138B order backlog (FY2025); 5–7 year lead times | €2B capacity expansion doesn't deliver until 2028+ |
| Hitachi Energy | Largest US transformer maker | 144-week GSU lead time; 274% GSU demand rise since 2019 | One of 4 firms with ~2/3 US large-transformer share |
| Constellation Energy | Largest US nuclear operator | 20-yr PPAs (MSFT 835 MW, META 1,121 MW); $16.4B Calpine acquisition | Contracted revenue lock above PJM spot |
| Vistra Corp | PJM dispatchable operator | 20-yr 2,609 MW PPA with Meta; 10,255 MW cleared 2026/27 at $273.45/MW-day | 100% hedged 2026; 84% 2027 |
Second-order chokepoints
Below the named first-order layer sits the layer the document explicitly wants — the upstream gates that determine whether the first-order list can scale.
Prysmian, Nexans, and NKT dominate high-voltage and HVDC submarine and land-cable manufacturing. Prysmian's Transmission backlog ran approximately €17 billion at FY2025 close; Nexans reported a Q1 2026 backlog of €7.9 billion; NKT's backlog rose from €10.2 billion at end-2025 to €13.5 billion in 2026.9 DC cable lead times now exceed five years; new cable-manufacturing facilities take three to four years to build. The HVDC backbone the offshore-wind and inter-regional-transmission build-out requires queues behind a three-firm oligopoly that cannot expand capacity faster than the demand curve.
Eaton and ABB sit at the medium-voltage switchgear and distribution-equipment layer. Eaton's Electrical Americas backlog has grown four times since 2019 to roughly $10 billion, with AI-related backlog up over thirty percent year-on-year in 2024.10 Lead times for complex assemblies stretch into multi-quarter ranges. The EU F-Gas Regulation banning SF6 in new medium-voltage switchgear from January 2026 (effective up to 24 kV in 2026, up to 52 kV by 2030) forces a transition to G3 / AirPlus alternative-gas insulants whose supply chain depends on 3M's specialty fluorochemicals. 3M announced its PFAS manufacturing phase-out in 2022, leaving the alternative-gas supply chain unresolved at the moment regulatory demand peaks — a genuinely overlooked second-order chokepoint that the trade press has barely begun to name.
Centrus Energy, Urenco, and Orano are the Western enrichment capacity that has to supply both conventional LWR fuel and HALEU for the SMR-and-advanced-reactor restart the hyperscaler PPAs are funding. Rosatom holds approximately forty-four percent of global enrichment capacity (27,100 thousand SWU per year); Urenco approximately twenty-nine percent (17,900 thousand SWU/yr); Orano approximately twelve percent (7,500 thousand SWU/yr).11 Centrus is the only current US producer of HALEU, at 900 kg per year at Piketon, Ohio — pilot-scale, not commercial. The Department of Energy selected Centrus for a $900 million task order to expand commercial-scale HALEU by 2030; until that facility comes online, HALEU is a pre-commercial chokepoint.
Cleveland-Cliffs is the named domestic producer of grain-oriented electrical steel (GOES) — the core input for power transformers.12 Single-source domestic supply for GOES creates a non-substitutable input gate on transformer-production scaling; the $500 million CHIPS/industrial grant directed to expand GOES capacity is one of the few federal interventions in the second-order layer. Transformer prices have risen approximately eighty percent over five years; inability to scale GOES output is a hard ceiling on domestic transformer production expansion. Sole-source status is widely reported but not yet verified in primary AISI or DOE documentation — flagged as an estimate against that primary-source standard.
BWX Technologies is the only currently operating US manufacturer of TRISO nuclear fuel for advanced and small modular reactors.13 BWXT restarted its TRISO line in Lynchburg, Virginia, and delivered the first full core for the Pentagon's Project Pele microreactor in December 2025; it is collaborating with Kairos Power for commercial TRISO supply. Without TRISO fabrication capacity, high-temperature gas and microreactor designs cannot be fuelled.
Applied here · The Falsifiability Method · §4a Watch-window-with-falsificationThe Falsifiability Method — watch-window-with-falsification
“every claim in the description carries a named threshold that would revise it. Not we will know more later but if X moves to Y, my read changes to Z. Falsifiability is built into the description itself, in the same paragraph as the description, not deferred to a closing caveat.”
Read →What would change my read
Three named thresholds with named mechanisms and named primary sources. Each one resolves the bottleneck claim in one direction or the other; none of them is a date.
The first is the PJM 2027/2028 Base Residual Auction. If the auction clears below $200/MW-day, new dispatchable capacity has entered faster than the load curve has grown; the tightening pattern is broken; the supply-side pricing power on the first-order list compresses, and the off-grid trajectory loses some of its forcing function. The 2027/2028 BRA report was published in December 2025 and the next auction's clearing pattern is the read on which side the arithmetic is moving.14 If the auction clears at or near the FERC cap again, the tightening intensifies.
The second is GE Vernova or Siemens Energy announcing available heavy-duty gas turbine delivery slots before 2029 for orders placed in 2026. Manufacturing-capacity expansion that overtakes the demand curve would dissolve the lead-time bottleneck, weakening the most cinematic component of the pricing-power story. The reverse — full booking through 2030 by end-2026 per Strazik's stated target — confirms the structural commitment is already in the order book through to the end of the decade.
The third is the off-grid generation share of newly planned data-centre capacity falling back below fifteen percent in 2026 and 2027 announcements. A reversion would indicate grid-interconnection timelines have shortened materially or FERC and state permitting have fast-tracked new transmission. Both would reduce the forcing function on off-grid capacity and compress the bilateral PPA premium feeding the nuclear-restart and gas-turbine arithmetic.
The thresholds are numeric, the mechanisms named, the sources primary; the read is falsifiable in advance of the resolution, which is the discipline the Method's fourth principle imposes on the description.
2. Materials & critical minerals
The Bottleneck Map's second sector descends to the layer below the chip stack and the grid — to the upstream raw inputs and, more critically, the midstream processing chemistry that turns mined ore into usable industrial input. Mining can be geographically distributed; chemistry is not. China holds approximately 91% of global rare-earth separation and refining and 94% of NdFeB permanent magnet manufacturing; the average refining share across the 19 strategic minerals the IEA tracks is around 70%. The pricing power sits with producer-country governments as much as with the mining companies themselves — sovereign export-control regimes are the bottleneck mechanism on top of producer concentration. Add to that ore-grade decline in copper, demand surge from electrification, AI capex, and defence, and the sovereign-gated supply curves crystallise into a structure that competing buyers cannot price out.
The arithmetic
Three structural conditions, each with primary-source attribution.
The first is processing concentration. China processed approximately 91% of global magnet rare earth production in 2025 and manufactured 94% of global NdFeB permanent magnets, up from roughly 50% two decades ago.15 The relevant number is not the mining share — the US, Australia, and Brazil all mine rare-earth concentrates — but the separation and refining step, where the solvent-extraction chemistry has been industrially scaled in China and only narrowly elsewhere. Across the 19 strategic minerals the IEA tracks, China's average refining market share is approximately seventy percent.
The second is sovereign gating. China's August 2023 gallium and germanium export controls produced an immediate and measurable supply disruption — Chinese germanium exports fell from 7,965 kg in July 2023 to 590 kg in October 2023, and gallium from 6,876 kg to 227 kg, an effective near-zero in the month the controls took effect.16 The December 2023 ban on rare-earth extraction and separation technology export prevents knowledge transfer to alternative processing sites. The April and October 2025 layers added restrictions on seven rare-earth elements and on foreign-produced magnets containing heavy rare earths above 0.1% — extending Chinese jurisdiction beyond Chinese borders.17 Military-affiliated end-users were denied licences entirely. The control regime is the binding mechanism; the underlying minerals are abundant.
The third is the physics of ore-grade decline in copper. Global average copper ore grade has fallen from ~1.5% in 1900 to ~0.6% by 2020; processing lower-grade ore drives ~13% higher energy intensity per tonne produced.18 Grade decline concentrates pricing power in the lowest-cost, highest-grade mines regardless of political-risk profile, and shifts the binding constraint from mine output to smelter and concentrator capacity — new smelters take seven to ten years to permit and build, and the Indonesian in-country smelting requirement (2023 export ban, conditionally waived since) forces greenfield investment that further concentrates the refining flow.
First-order chokepoints
Six entities, clustered by mineral class.
MP Materials operates the Mountain Pass mine in California, the only US-domiciled rare-earth concentrate producer at scale. The company produced 45,455 metric tonnes of rare-earth oxide in concentrate in 2024 (a record) and 1,294 mt of NdPr oxide, with NdPr metal and magnet production commencing at its Independence facility from late 2024 and 2025.19 Department of Defense and General Motors offtake agreements gate domestic access to the magnet supply chain; the DoD price-floor mechanism functions, in practice, as sovereign buyer-of-last-resort for US-sovereign rare-earth feedstock.
Lynas Rare Earths operates Mt Weld in Australia with processing capacity in Kalgoorlie (Australia) and Malaysia. Lynas is the largest rare-earth producer outside China, with NdPr family production capacity around 10,500 tpa, and is the only commercial-scale rare-earth separation operator outside China.20 The Malaysian operating licence has been renewed under conditions that allow continued cracking and leaching. Geographic diversification from China is the structural value proposition; pricing power follows from being the named non-Chinese option for OEMs constrained by the October 2025 MOFCOM rules.
SQM holds approximately sixty-five percent of Chilean lithium output, producing 201,000 mt of lithium carbonate equivalent from the Salar de Atacama in 2024 — the largest single lithium brine operation in the world.21 The Chilean state contract (CORFO) governs volumes and pricing through 2030; the Atacama brine lithology cannot be replicated elsewhere at similar cost. Sovereign-gated pricing power sits with the Chilean state structure as much as with SQM itself.
CMOC produced approximately 114,000 mt of cobalt in 2024 — about thirty-one percent of global market share — across its TFM and KFM operations in the Democratic Republic of Congo; the DRC supplied over seventy percent of global mined cobalt output in 2024.22 CMOC's first-mover position in the DRC's new export-quota system (launched late 2024) consolidates the access advantage Chinese state-linked operators hold in DRC mineral concession negotiations.
Freeport-McMoRan sold approximately 4.1–4.2 billion pounds of copper in 2024 across Grasberg (Indonesia), Cerro Verde (Peru), and Morenci (Arizona).23 Grasberg's underground operation is one of the world's highest-grade remaining copper-gold deposits. The new PT-FI smelter and precious-metals refinery in Eastern Java, mandated by Indonesian in-country processing rules, tightens concentrate supply to third-party smelters globally.
Kazatomprom produced approximately twenty-one percent of primary global uranium output in 2024 from Kazakhstani operations; combined Kazatomprom and Cameco share of primary supply exceeds forty percent.24 Sovereign-state ownership of Kazatomprom gives Kazakhstan direct influence over uranium term-contract pricing — and term contracts have risen from sub-$30/lb in 2020 to $90+/lb in the current cycle.
On the income statement, the pricing power sits in the rare-earth-separation gross margin at the Chinese chemistry operators (JL Mag and the refining oligopoly) — and in the non-China supply premium at MP Materials (DoD price-floor offtake) and Lynas (the only commercial-scale non-Chinese separator). Sovereign export-control regimes are the binding mechanism on top of producer concentration.
| Holder | Position | Key metric | Mechanism |
|---|---|---|---|
| MP Materials | Only US-domiciled rare-earth concentrate producer at scale | 45,455 mt REO concentrate, 1,294 mt NdPr oxide (2024) | DoD price-floor offtake; GM offtake |
| Lynas Rare Earths | Largest non-China rare-earth producer | ~10,500 tpa NdPr capacity | Only commercial-scale non-Chinese separator |
| SQM | Chilean lithium dominant | 201,000 mt LCE (2024); ~65% Chilean output | CORFO contract through 2030; Atacama brine |
| CMOC | DRC cobalt dominant | ~114,000 mt cobalt (2024); ~31% global share | First-mover in DRC export quota; TFM/KFM operations |
| Freeport-McMoRan | US/Indonesian/Peruvian copper | 4.1–4.2bn lbs copper (2024); Grasberg high-grade | PT-FI smelter; Indonesian in-country processing |
| Kazatomprom | Kazakhstan uranium dominant | ~21% global primary uranium output (2024) | Sovereign ownership; term contracts $30 → $90+/lb |
The Math Doesn't Work — sovereign capital as buyer of last resort
“Sovereign capital is functioning as buyer of last resort. UAE and Saudi Arabia have collectively committed over $100 billion to AI infrastructure; the US approved export of advanced chips to both countries in November 2025. Sovereign wealth funds can deploy capital at a scale and over a timeframe that private investors cannot match.”
Read →Second-order chokepoints
Below the named first-order layer sits the separations-and-conversion chemistry where the bottleneck binds tightest.
Neo Performance Materials operates the Silmet plant in Estonia — the only commercial rare-earth separation operation in the European Union — and Europe's first mass-production NdFeB magnet facility at Narva, which opened in September 2025 with initial capacity of 2,000 mt/yr targeting 5,000 mt/yr.25 Neo also commissioned a heavy-rare-earth separation line in Europe to handle dysprosium and terbium. The company controls the full EU value chain from separation to finished magnet, and is targeted to satisfy up to fifteen percent of EU magnet demand. The structural value is being the only entity outside China and Japan/Korea able to supply automotive-grade magnets at scale to European OEMs constrained by the October 2025 MOFCOM extraterritorial rules.
The Chinese magnet complex — JL Mag Rare-Earth, alongside named non-China producers Proterial (formerly Hitachi Metals, Japan) and TDK (Japan) — manufactures the ninety-four percent of global NdFeB permanent magnets that downstream EV, wind-turbine, defence, and consumer-electronics OEMs need.17 The October 2025 MOFCOM controls extend Chinese export jurisdiction over foreign-produced magnets containing heavy rare earths above 0.1%, which means a magnet manufactured in Japan or the United States with even a trace of Chinese-sourced dysprosium falls under the licensing regime. The December 2023 technology export ban blocks new entrants from replicating the separation chemistry domestically without years of process-engineering build.
Albemarle runs the lithium conversion and separations chemistry that feeds US-sovereign battery supply chains. The Kings Mountain mine restart in North Carolina is backed by approximately $240 million in federal grants and targets full-scale operations in late 2026.26 Albemarle posted $5.4 billion of revenue in 2024 against a $1.2 billion net loss as the lithium price cycle inverted, and the IRA's "Buy American" provisions effectively gate EV battery tax credits through domestic lithium conversion — Albemarle is one of the very few credible US-sovereign counterparties at scale.
Copper smelter and concentrator capital equipment is the second-order layer below the mines. Metso and FLSmidth — the named equipment vendors who supply the capital equipment for new smelter capacity — gate the rate at which new smelters come online globally.27 Each greenfield smelter takes seven to ten years to permit and commission. As ore grades decline, refining capacity tightens regardless of what mine output does, and pricing power flows to the equipment-vendor oligopoly upstream of the operators.
What would change my read
Three named thresholds with named mechanisms and named primary sources.
The first is non-Chinese NdPr separation capacity exceeding thirty percent of global supply, versus the approximately nine percent that sits outside China today per the IEA's Critical Minerals Outlook.15 At that threshold, China's export-control leverage over magnet supply chains becomes partial rather than near-total — users have credible alternative feedstock sources, breaking the processing chokepoint that makes export restrictions effective. The MP Materials Independence facility, the Lynas Kalgoorlie processing buildout, and the Neo Performance Estonia/Narva integration are the three named projects whose collective ramp would close on that threshold.
The second is the substitution pathway maturing. Lithium iron phosphate cathode chemistry displacing nickel-manganese-cobalt above fifty percent of new global EV production would reduce the bottleneck value of cobalt and high-grade nickel processing. Sodium-ion battery chemistry maturing into commercial-scale EV and grid storage would erode the lithium-conversion gate. Rare-earth-free permanent-magnet motor architectures (induction, wound-rotor, switched-reluctance) reaching mainstream adoption in EV drivetrains would weaken the rare-earth specifically-for-EV claim — though defence demand and wind-turbine demand persist. Each substitution has named primary sources at the IEA's Global EV Outlook and the equivalent battery-technology trade publications.
The third is a sovereign action at the DRC level on CMOC's TFM/KFM operating licences. The DRC government has the precedent — Tenke Fungurume was effectively nationalised once before, in 2022, when Kinshasa disputed Freeport's original sale to CMOC. A repeat would remove thirty-one percent of global cobalt supply from the market simultaneously. The DRC's new export-quota system suggests Kinshasa is now extracting rents rather than nationalising, which would update the read in the opposite direction. Primary sources: DRC Ministry of Mines official communications on TFM/KFM licence status, CMOC's Shenzhen Stock Exchange material-event disclosures, and IMF Article IV consultations on DRC mining-revenue capture.
If non-Chinese separation capacity scales, if substitution chemistries mature, or if DRC sovereign action repeats, the sector's pricing-power claim weakens. If the trends hold, the claim is reinforced. Either way, the description is falsifiable in advance against named primary sources.
3. Chips and the compute stack
The chip stack is the layer where the manuscript's AI-math argument lives in the dollar terms most visibly. Hyperscaler capex moving more than ten times faster than disclosed AI revenue; $725 billion of 2026 capex guidance from the four largest hyperscalers; NVIDIA data-centre revenue of $193.7 billion for fiscal 2026; fab lead times of three to seven years; advanced packaging that cannot be doubled in under eighteen months; EUV lithography systems shipped at forty-eight units in a year against a €38.8 billion backlog. The pricing power sits with the architecture-IP layer (NVIDIA), the foundry layer (TSMC), the lithography layer (ASML), and the high-bandwidth-memory layer (SK Hynix, Samsung, Micron). Downstream of materials (Sector 2) and energy (Sector 1); upstream of everything else. The sequential monopoly is the structural fact.
The arithmetic
Three numbers anchor the sector.
The first is the capex-to-revenue gap. Combined 2026 capex guidance from Microsoft, Alphabet, Amazon, and Meta is approximately $700–725 billion, up roughly sixty-seven percent year-on-year, with around seventy-five percent (~$450 billion) attributed to AI-specific infrastructure.28 Against this, NVIDIA's fiscal-2026 data-centre revenue was $193.7 billion, the single largest disclosed AI-attributable line on any income statement in the industry.29 The manuscript's frame — capex moving more than ten times faster than revenue — is the arithmetic gap that has to close, either by AI revenue ramping into the capex, by capex guidance compressing, or by some combination. None of the three has happened in the last twelve months at the scale the gap would require.
The second is the structural lead time. TSMC's N3 node is fully booked through 2027. N2 entered high-volume manufacturing in Q4 2025 at approximately forty thousand wafers per month and expands toward one hundred thousand wafers per month through 2026.30 CoWoS advanced-packaging capacity — the integration step that binds HBM to GPU die — ran approximately thirty-five to forty thousand wafers per month in late 2024, is targeted at around sixty-five thousand by end-2025, and around one hundred and thirty thousand by end-2026, with NVIDIA alone holding sixty percent or more of allocated slots through 2027.31 Fab construction cycles run three to seven years; advanced-packaging capacity cannot be doubled inside eighteen months. The constraint is mechanical.
The third is the lithography monopoly. ASML shipped forty-eight EUV systems in full-year 2025 against a year-end backlog of €38.8 billion, with High-NA EUV priced at €320–400 million per unit.32 Every advanced fab in the world queues behind a single equipment vendor for the machines that pattern sub-5nm features. There is no substitute. The Dutch export-control regime further limits who can receive a tool: the structural sequential monopoly extends from sovereign control over export licences down through the chemistry-supply layer the next sub-section names.
Applied here · The Falsifiability Method · §3 Structural-vs-cyclicalThe Falsifiability Method — structural vs cyclical
“the math is structural; the timing is the question. The aphorism runs through both manuscript essays. It distinguishes the diagnosis — which is true regardless of which year — from the trigger, which is unknown until it fires.”
Read →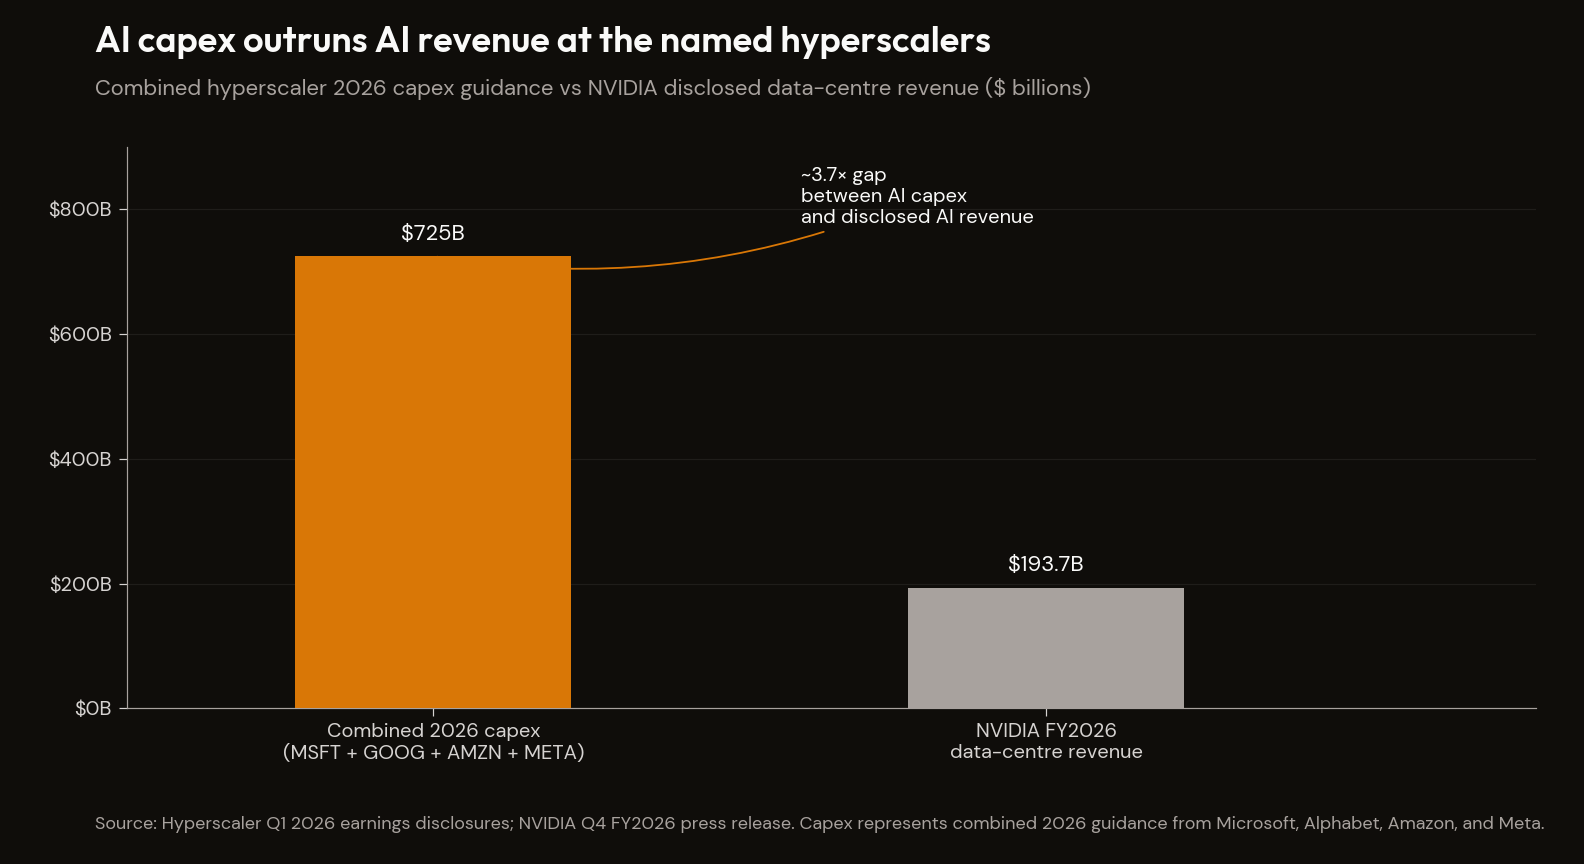
First-order chokepoints
Five entities define the layer.
NVIDIA holds approximately eighty percent of the AI accelerator market across training and inference.33 The CUDA software moat — the parallel-computing platform NVIDIA has invested in for nearly two decades — is the named switching cost: rewriting kernel code, retraining engineering teams, qualifying model checkpoints against alternative compiler stacks, all in the service of an architecture (AMD, Broadcom ASIC, Google TPU) that has not yet demonstrated frontier-grade training at the scale CUDA does. Blackwell is sold out through mid-2026 with an approximately 3.6 million unit backlog; networking IP (Mellanox, NVLink) and InfiniBand round out the system-level lock-in. NVIDIA's fiscal-2026 data-centre revenue was $193.7 billion, up sixty-eight percent year-on-year.
TSMC is the only foundry currently producing at the leading nodes — N3 and N2 — and the only foundry providing CoWoS advanced packaging at the volume the NVIDIA / AMD / Broadcom system roadmap requires.30 Approximately ninety-two percent of advanced-node fab capacity globally sits inside TSMC. Each new fab costs $20–30 billion to commission. There is no near-term substitute at sub-3nm. Apple, NVIDIA, AMD, and Broadcom are all dependent on the same supply line; CoWoS NVIDIA allocation alone exceeds sixty percent through 2027.
ASML is the sole supplier of EUV lithography systems and the sole supplier of High-NA EUV (required for sub-2nm production).32 The €38.8 billion backlog is not a sales pipeline — it is a multi-year queue inside which the company is rationing access. Twenty-plus years of accumulated IP and the service-and-spares revenue stream on the installed base compound the monopoly. Dutch export-control compliance further limits who can receive a machine.
SK Hynix holds approximately fifty-seven to sixty-two percent of the HBM market in 2025 — up from second place a year earlier — and is NVIDIA's primary HBM3e vendor across the H100, H200, and Blackwell platforms.34 Samsung and Micron hold the residual share (Samsung approximately seventeen percent, Micron approximately twenty-one percent per Q2 2025 market data). HBM4 is roadmapped for the Rubin platform; the three-supplier structure persists through the next generation, with SK Hynix dominant on most NVIDIA SKUs.
Broadcom sits in the custom-AI-ASIC layer for Google, Meta, OpenAI, and Anthropic, alongside AI networking silicon (Tomahawk, Jericho).35 Broadcom holds approximately sixty percent of the AI ASIC market with a $73 billion backlog and TSMC capacity secured through 2028. The Broadcom story has displaced AMD in the first-order layer of this sector — the hyperscaler relationship is where the durable pricing power sits, while AMD's MI300 / MI325 line has not yet broken out of NVIDIA's training shadow.
On the income statement, the pricing power sits in the foundry-services gross margin at TSMC (supporting the ~92% advanced-node share), the GPU gross margin at NVIDIA (supporting the CUDA-protected $193.7 billion data-centre revenue line), the EUV-system selling-price line at ASML (€38.8 billion backlog at €320–400M per High-NA unit), and the HBM contribution margin at SK Hynix (the AI-memory line that drove its 2025 profit-overtake of Samsung). IP, capital-intensity, and sequential-monopoly moats compound across the layer.
| Holder | Position | Key metric | Mechanism |
|---|---|---|---|
| NVIDIA | AI accelerator dominant | ~80% market share; $193.7B FY2026 data-centre revenue (+68% YoY); Blackwell 3.6M backlog | CUDA software moat; system-level IP (Mellanox, NVLink, InfiniBand) |
| TSMC | Sole leading-node foundry | ~92% advanced-node fab capacity; N3 fully booked through 2027 | CoWoS advanced-packaging exclusivity; NVIDIA ~60% allocation through 2027 |
| ASML | Sole EUV lithography supplier | €38.8B backlog (year-end 2025); High-NA at €320–400M/unit | Twenty-plus years accumulated IP; Dutch export-control compliance |
| SK Hynix | HBM market leader | 57–62% HBM share (2025); primary NVIDIA HBM3e vendor | Roadmapped through HBM4 (Rubin platform) |
| Broadcom | Custom AI ASIC layer | ~60% AI ASIC share; $73B backlog; TSMC capacity secured through 2028 | Hyperscaler relationships (Google, Meta, OpenAI, Anthropic) |
Second-order chokepoints
Below NVIDIA / TSMC / ASML / HBM / Broadcom sits a layer of sequential monopolies most of the financial press has never had to name.
Ajinomoto is the sole commercial resin supplier for Ajinomoto Build-up Film — the dielectric resin used in every advanced CPU, GPU, and ASIC package substrate.36 Market share for ABF laminating film is above ninety-five percent. Ajinomoto notified customers of a thirty percent price hike effective Q3 2026 against a projected supply shortfall of ten percent in H2 2026, widening to forty-two percent by 2028. The single meaningful challenger (Sekisui Chemical) holds approximately five percent. Below Ajinomoto, the substrate fabricators (Ibiden, Unimicron, Shinko Electric) hold a tight oligopoly on the final substrate assembly. Every chip in every AI rack passes through this resin chemistry.
JSR, Shin-Etsu Chemical, and Tokyo Ohka Kogyo dominate EUV-grade photoresist supply. The Japanese chemical industry holds approximately ninety-five percent of the high-end EUV photoresist market.37 No Western peer carries qualified EUV-grade formulations at scale. JSR (now owned by JIC, a Japanese state-backed investment vehicle) and Shin-Etsu collectively supply the two dominant chemistries; Tokyo Ohka, Fujifilm, and Sumitomo Chemical round out the layer. Photoresist supply is the most concentrated chemistry chokepoint in the entire compute stack.
Mitsui Chemicals is the dominant commercial supplier of EUV pellicles — the protective membranes that shield EUV reticles from contamination during lithography.38 Mitsui licensed the original ASML pellicle technology in 2021 and has partnered with imec on next-generation carbon-nanotube pellicles targeting high-power EUV by 2025–2026. The market is small — approximately $558 million in 2024 — but single-source: without a pellicle, the reticle contaminates after a few wafer passes, and the fab loses the EUV machine to the contamination problem.
KLA Corporation holds approximately sixty percent of the semiconductor metrology and inspection equipment market — the process-control layer that detects defects at every manufacturing step.39 As fabs move to N3 and N2, defect rates become economically decisive: a yield miss at advanced nodes propagates into multi-billion-dollar capex losses. KLA's share of total fab spend rises structurally with node complexity. The metrology-and-inspection market doubled from $6.0 billion in 2020 to $12.9 billion in 2025.
Neon and rare gases carry the longest-tail geographic concentration. Approximately fifty percent of global ultra-high-purity neon — used as buffer gas in argon-fluoride laser lithography — has historically come from Ukrainian steel-mill byproduct capture.40 The 2022 conflict-era supply shock prompted diversification and recycling investment, but the geographic concentration of the production infrastructure persists as a stress-tested second-order chokepoint that could re-bind under a future supply disruption.
Applied here · Signal · AI capex / revenue gap · What would change my readAI capex / revenue gap — falsifiability statement
“A sustained inflection in disclosed AI-related revenue at the hyperscalers — combined with margin expansion that demonstrates pricing power rather than introductory subsidisation — would ratify the capex. Hyperscaler free-cash-flow turn is the cleanest single threshold.”
Read →What would change my read
Three thresholds with named mechanisms.
The first is the named manuscript trigger — the Anthropic round closing at $900 billion and any of the four major hyperscalers issuing capex-guidance cuts in successive quarters. The Anthropic close at that level would mark a terminal-stage dot-com analogue on a private-market basis. Successive guidance cuts at hyperscaler scale would signal that AI-attributable revenue is not ratifying the investment thesis, compressing demand upstream through every layer of the stack simultaneously. Both are tracked directly in the signal MDX dashboard.
The second is the DeepSeek-class efficiency curve maturing. The DeepSeek R1 release in January 2025 erased over $500 billion of NVIDIA market capitalisation in a single trading day by demonstrating frontier-grade performance on a fraction of the compute budget using export-controlled chips. If subsequent open-source releases compound the efficiency curve — Llama 5, an Anthropic open-weight release, a Mistral training-cost breakout — the structural assumption underwriting hyperscaler capex (that more compute equals more capability) weakens. NVIDIA's pricing power on H- and B-series GPUs rests partly on the CUDA software switching cost; if compiler abstractions (XLA, Triton) sufficiently decouple model training from CUDA, GPU commodity risk rises.
The third is ASML High-NA EUV ramp slippage or acceleration. The High-NA timeline determines when sub-2nm production can scale; ASML's quarterly disclosures are the primary source. Slippage tightens the constraint; acceleration loosens it. CoWoS capacity reaching one hundred and thirty thousand wafers per month by end-2026 on schedule, with N2 yield improving to two hundred thousand wafers per month by 2027 on plan, would weaken the physical-chokepoint narrative — hyperscalers receive allocated silicon on faster timelines.
If the manuscript-named triggers fire, the structural arithmetic the sector describes is confirmed in motion. If the efficiency curve breaks the demand curve or the supply-side capacity overtakes the demand curve, the read updates in the opposite direction. The threshold structure is in the description, not in a closing caveat.
4. Eldercare & specialty pharma
Demographic compounding is the slowest of the bottleneck mechanisms and one of the hardest to expropriate. Four million Americans turn 65 each year through the Peak 65 window; the worker-to-beneficiary ratio that funds Medicare and Social Security has fallen from 5.0 in 1960 to 2.7 in 2024 and is on track to 2.3 by 2040. Medicare HI projected depletion sits at 2033 per the Trustees Report and 2040 per the CBO — the seven-year methodological gap is the manuscript's canonical exemplar of gap-as-diagnosis. Into this fiscal compression, three branded drug classes have introduced structural pricing power — GLP-1 receptor agonists, anti-amyloid Alzheimer's antibodies, and the dialysis duopoly — at the moment Medicare's absorption capacity is most constrained. The pricing power sits with branded-drug monopolies, vertically integrated managed care, demographic-locked-demand REIT operators, and the upstream peptide CMOs that gate the supply curve.
The arithmetic
Three demographic-and-fiscal facts, each from a primary source.
The first is Peak 65 itself. In 2024, a record 4.1 million Americans turned 65 — approximately 11,200 per day — with the same pace sustained through at least 2027.41 The worker-to-beneficiary ratio that funds Medicare and Social Security has fallen from above 5.0 workers per beneficiary in 1960 to approximately 2.7 in 2024 and is projected to reach 2.3 by 2040 as the boomer cohort completes its transition into retirement.42 These numbers are not forecasts — the people who turn 65 through 2040 are already alive. The demographic curve is locked in.
The second is the Medicare HI gap. The 2025 SSA Trustees Report projects Medicare HI (Part A, hospital insurance) trust-fund depletion in 2033, at which point the fund can pay only eighty-nine percent of scheduled Part A benefits.43 The CBO's February 2026 projection, incorporating the fiscal effects of Public Law 119-21 (the One Big Beautiful Bill Act), now places HI depletion in 2040 — twelve years earlier than the CBO's March 2025 estimate.44 The seven-year gap between Trustees (2033) and CBO (2040) is the Method's canonical exemplar of gap-as-diagnosis: the same set of underlying conditions produces two answers, and the gap itself is the structural finding. The CBO's revision moves in the direction the Method's framing already named.
The third is the specialty-pharma revenue ramp. Novo Nordisk's 2024 total net sales reached approximately $41 billion (DKK 290.4 billion), with a fifty-five percent global value share in the GLP-1 segment; Ozempic alone generated DKK 120 billion ($17 billion) and Wegovy DKK 58 billion ($8 billion).45 Eli Lilly's tirzepatide franchise — Mounjaro and Zepbound — generated $11.54 billion and $4.93 billion respectively in full-year 2024.46 The branded GLP-1 duopoly's combined 2024 revenue from semaglutide and tirzepatide approached $40 billion. Patent-protected pricing flows into Medicare Part B and commercial-insurance reimbursement; the IRA cost-cap negotiation authority does not apply to Part B, which excludes the GLP-1 injectables billed in clinical settings.
The Falsifiability Method — gap-as-diagnosis (Medicare HI)
“Medicare HI — Part A, hospital insurance — has two depletion projections from the two institutions tasked with publishing them. The 2025 Trustees Report says 2033. The CBO says 2040. The same set of underlying conditions produces two answers, seven years apart.”
Read →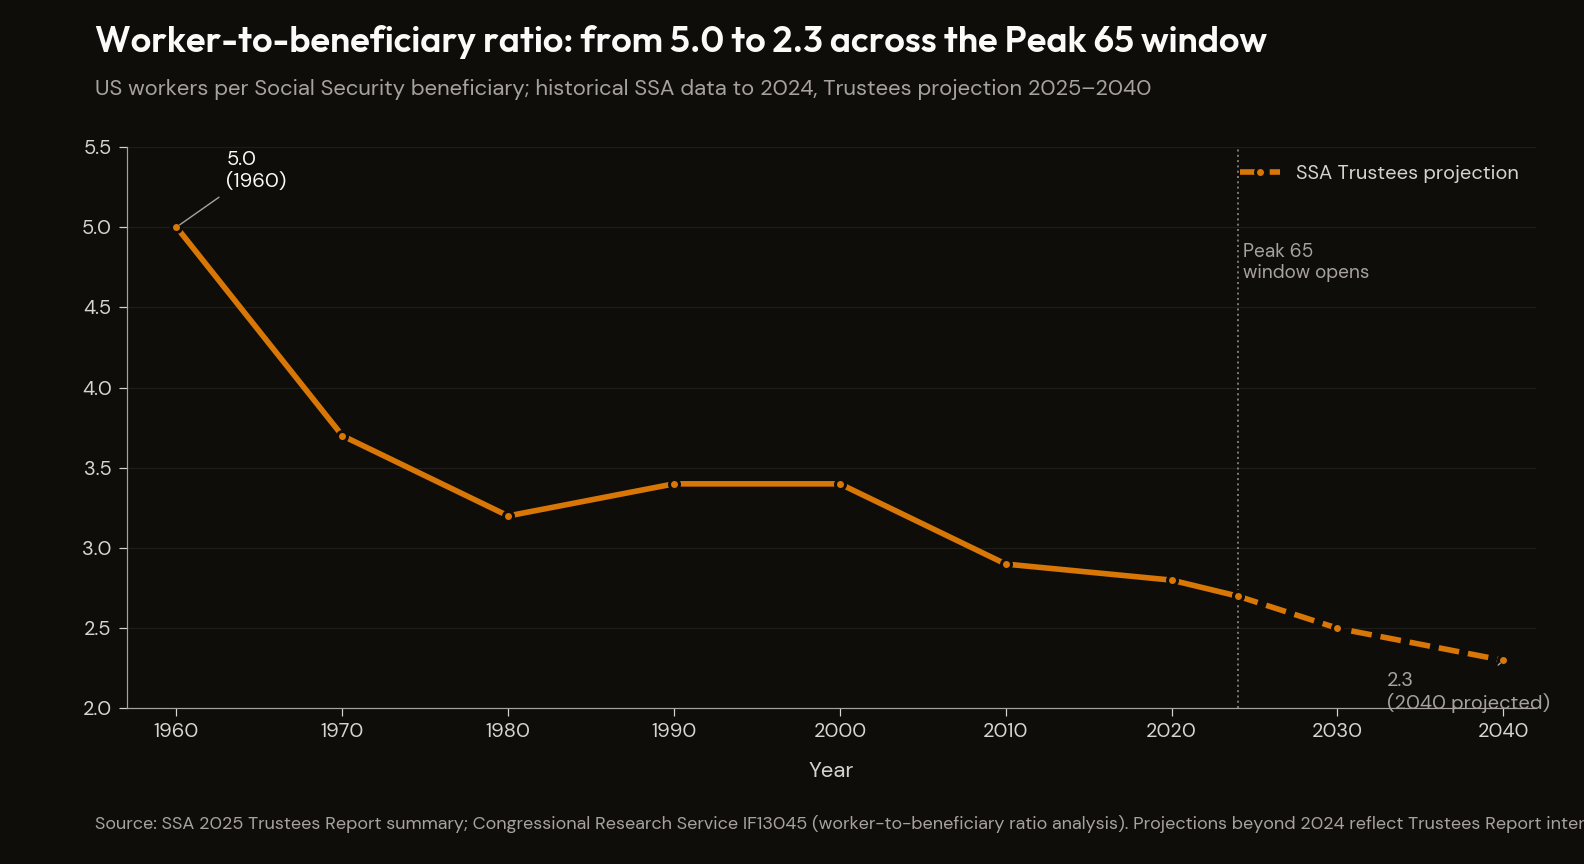
First-order chokepoints
Six entities define the first-order layer; cluster by therapeutic class and care-delivery vertical.
Novo Nordisk and Eli Lilly are the GLP-1 duopoly. Novo holds semaglutide (Ozempic for diabetes, Wegovy for obesity, Rybelsus oral); Lilly holds tirzepatide (Mounjaro for diabetes, Zepbound for obesity), a dual GIP/GLP-1 agonist with stronger weight-loss efficacy in head-to-head trials.47 Patent protection extends to 2030+ for Ozempic and 2036+ for Mounjaro; until generic competition arrives, the duopoly captures the entirety of the obesity-and-diabetes branded prescription flow. Manufacturing capacity is the gating constraint — both companies have made fill-finish acquisitions to relieve the bottleneck (Novo's Catalent site acquisition is named below as a second-order chokepoint).
Eisai/Biogen (Leqembi, lecanemab) and Eli Lilly (Kisunla, donanemab) hold the Alzheimer's anti-amyloid duopoly — the first disease-modifying drug class in US history.48 Leqembi prices at approximately $26,500 per year; Kisunla at approximately $32,000 per year (variable by treatment duration). Medicare Part B reimbursement with twenty percent patient co-pay generates roughly $5,000 of out-of-pocket exposure per patient per year. The IRA Part D cost-cap does not apply (these are Part B drugs); the pricing-power mechanism is regulatory-categorical.
DaVita and Fresenius Medical Care hold the dialysis duopoly. Combined US outpatient dialysis market share rose from 59.1% in 2005 to 77.1% in 2019 — the most recent published combined-share figure — across approximately 281,100 DaVita patients in 2,657 US centres.49 DaVita's FY2024 revenue was $12.816 billion. End-Stage Renal Disease network effects and Medicare's ESRD-program reimbursement structure entrench the duopoly; approximately thirty-two percent of the US population lives in areas with no non-duopoly dialysis option.
UnitedHealth Group / Optum is the vertically integrated managed-care operator — the largest Medicare Advantage insurer, the largest US physician employer, and the operator of Optum Rx.50 The chokepoint mechanism is the vertical capture of the spread between pharmacy, insurance, and provider services: Optum pays its own employed physicians ~17% more than non-Optum physicians on average (61% more in concentrated markets), with Optum's operating income exceeding UnitedHealthcare's for the first time in 2024 and Medicare Advantage enrolment up 77% since 2017. CVS Health / Aetna / Caremark, Cigna / Express Scripts / Evernorth, and Humana hold the residual vertically integrated layer.
Welltower and Ventas are the long-term-care REITs — landlord to senior-housing operating portfolios at approximately ninety-five percent occupancy.51 Welltower's Seniors Housing Operating segment was seventy-six percent of total 2024 revenues. The demographic tailwind creates pricing power at the property level; the REIT operators are converting triple-net lease properties to RIDEA (operating) structures to capture more of the underlying property-level upside.
On the income statement, the pricing power sits in the branded-GLP-1 revenue lines at Novo Nordisk and Eli Lilly (Ozempic alone at DKK 120 billion in 2024), in Medicare Part B billing for the anti-amyloid duopoly (Leqembi at ~$26,500/year; Kisunla at ~$32,000/year, both outside IRA negotiation), in DaVita's ESRD-reimbursement revenue line, and in the spread between Medicare Advantage premium revenue and Optum-cost transfer pricing at UHG. IP-cliff, regulatory-categorical, and demographic-locked moats hold each line.
| Holder | Position | Key metric | Mechanism |
|---|---|---|---|
| Novo Nordisk + Eli Lilly | GLP-1 duopoly | Ozempic DKK 120B + Wegovy DKK 58B (2024); tirzepatide $11.54B + $4.93B (2024) | Patent protection to 2030+ (Ozempic), 2036+ (Mounjaro); fill-finish capacity gating |
| Eisai/Biogen + Eli Lilly | Anti-amyloid duopoly | Leqembi $26,500/yr; Kisunla $32,000/yr; first disease-modifying Alzheimer's class | Medicare Part B billing (outside IRA negotiation) |
| DaVita + Fresenius | Dialysis duopoly | 77.1% combined US share (2019); DaVita 281,100 patients across 2,657 centres | Medicare ESRD reimbursement; network effects |
| UnitedHealth / Optum | Vertically integrated managed care | Largest Medicare Advantage insurer + largest US physician employer + Optum Rx | Vertical capture: Optum pays own physicians 17% more (61% in concentrated markets) |
| Welltower + Ventas | Long-term-care REITs | ~95% senior-housing occupancy; Welltower 76% revenue from SHOP | Demographic-locked demand; RIDEA conversions capture property-level upside |
OASI depletion year — why this matters
“Once the trust fund exhausts redeemable IOUs, the Social Security Act mandates that benefits can be paid only out of incoming payroll-tax receipts — which on current projections funds roughly 73–77% of scheduled benefits. The remaining 23–27% is the statutory cut. The political system can choose how to absorb it; it cannot choose whether the constraint binds.”
Read →Second-order chokepoints
Below the first-order layer sit the upstream capacity gates and the wholesale-distribution oligopoly through which every drug passes.
Bachem (Switzerland) and Polypeptide Group (Sweden/Belgium) are the peptide CMO duopoly that manufactures the active pharmaceutical ingredient for GLP-1 drug substance. Bachem's Building K in Bubendorf will more than double commercial peptide API capacity, with over CHF 400 million invested in 2024–2025 and commercial production ramping in H2 2025.52 Polypeptide is expanding its Malmö facility by €100 million. Capacity gating at the peptide CMO layer determines how fast the Novo/Lilly duopoly can grow GLP-1 volume; until the new capacity ramps, manufacturing constraints — not patent expiry — set the supply curve.
McKesson, Cencora, and Cardinal Health are the wholesale drug distribution oligopoly — three companies moving approximately 90–95% of US pharmaceuticals at combined ~$900 billion of revenue (McKesson $309B FY2024; Cencora $321B FY2025; Cardinal Health $223B FY2025).53 The chokepoint mechanism is two-layered in federal law: the Prescription Drug Marketing Act of 1987 established the wholesale distribution licensing framework inside which the three-firm structure consolidated through the 1990s and 2000s; the Drug Supply Chain Security Act of 2013 then raised the track-and-trace compliance bar in a way that further entrenched the existing oligopoly by making smaller-distributor entry economically prohibitive. A regulatory moat in federal law, not in any single company's IP. No generic, branded, or specialty drug reaches a US patient outside this layer; federal-level reform of the wholesale-distribution licensing regime is the only path to deconstruction.
The India/China API supply chain is the upstream layer for the generic prescription supply that handles ninety percent of US prescription volume by unit.54 India supplies ~48% of US-imported APIs; China ~13%; India itself sources 70–80% of its own APIs from China — combined India-and-China structural exposure approaches ~45% per USP analysis. The chokepoint mechanism is geographic, not corporate: a regulatory or trade action against either supplier bloc transmits directly into US generic-drug pricing.
Novo Holdings / Catalent absorbed the fill-finish manufacturing bottleneck for injectable GLP-1 biologics. Novo Holdings acquired Catalent for $16.5 billion in December 2024; Novo Nordisk simultaneously acquired Catalent's Belgium, Italy, and Indiana manufacturing sites for approximately $11 billion.55 The Belgium facility's vial capacity runs approximately 100–150 million per year; Indiana approximately 70 million. The acquisition effectively verticalised the GLP-1 supply chain inside Novo's control. Lilly has pursued a parallel build-out at Indianapolis and Concord with announced capex of approximately $9 billion through 2026. The fill-finish layer is what makes the manufacturing-capacity constraint a downstream pricing-power mechanism rather than just a supply shortage.
What would change my read
Three named thresholds with named mechanisms.
The first is the IRA's Inflation Reduction Act Part B drug negotiation authority extending to Leqembi, Kisunla, or GLP-1 injectables. Currently, IRA direct-negotiation and out-of-pocket-cap provisions apply only to Part D drugs. Both the Alzheimer's anti-amyloid class and the GLP-1 injectables (administered in clinical settings) are billed under Part B, which is excluded from the negotiation regime. If Congress extends IRA negotiation authority to Part B — or reclassifies these drugs — the pricing mechanism collapses for both the Alzheimer's and GLP-1 chokepoints simultaneously. CMS, KFF, and the CBO's score-tracking publications are the named primary sources.
The second is Bachem's Building K achieving full commercial production ramp without yield or regulatory delay. If Building K fully ramps by end-2026 as planned and Polypeptide's Malmö and Belgium expansions come online, the peptide API supply constraint eases materially. Biosimilar and generic entrants (semaglutide biosimilars are already in development pipelines in India and Brazil) gain access to the manufacturing capacity that has gated their entry. The pricing-power thesis on the GLP-1 duopoly weakens if supply-side normalisation precedes the patent-cliff dates.
The third is the CBO HI depletion projection moving further in either direction from the current 2040 figure. The February 2026 CBO projection at 2040 already incorporates Public Law 119-21 deterioration. Further reconciliation legislation that reduces payroll-tax receipts (additional tax cuts for seniors, payroll-tax-base reduction) would advance the depletion date. Conversely, GLP-1 adoption reducing obesity-related hospitalisations could extend solvency — an empirically testable offsetting effect modelled in the JAMA Health Forum 2024–2025 GLP-1 cost-effectiveness literature and tracked through CBO's annual Medicare baseline series, though no official CBO score yet incorporates the offset. Primary sources: CBO publication series on Medicare HI projections (cbo.gov/topics/medicare); JAMA Health Forum on GLP-1 fiscal offset modelling.
If the IRA expands to Part B, if the peptide-CMO supply curve normalises, or if the CBO projection moves further, the sector's snapshot needs re-drawing. The thresholds are named in advance.
5. Private credit & the annuity backstop
The Bottleneck Map closes on the financial-transmission layer where the stress from the first four sectors lands. Hyperscaler capex flows into private credit through the named hyperscaler-debt-as-asset-class trade; private credit flows into insurance balance sheets through the spread-capture mechanism the Apollo-Athene template formalised; insurance balance sheets flow into annuity end-buyers — retirees whose annuity contracts cannot be unwound. The integrated bubble runs its longest arc here. Global private credit AUM reached approximately $2 trillion by Q2 2024; US private credit $1.34 trillion. The KBRA shadow default rate ran at approximately six percent in Q3 2025 against a headline rate of 2.1% — the gap, surfaced by audit posture, is the central transparency problem of the asset class. The pricing power sits with the integrated insurance-and-credit platforms, the Bermuda regulatory regime that enables the asset structure, the rating-agency duopoly that prices the debt into "investment grade," and the actuarial firms that sign off on the reserve adequacy.
The arithmetic
Three numbers anchor the sector.
The first is the asset-class size. Global private credit reached approximately $2 trillion by Q2 2024 and continues expanding; the US segment alone totalled $1.34 trillion by the same date, having grown roughly five times since 2009.56 The Fed's May 2026 FEDS Note Bank Lending to Private Credit: Size, Characteristics, and Financial Stability Implications is the primary source for both figures. The April 2026 IMF Global Financial Stability Report corroborates and flags the rapid expansion as a systemic concern. The transmission mechanism back into the banking system runs at scale — bank credit commitments to nonbank financial entities grew from approximately $8 billion in Q1 2013 to approximately $95 billion in Q4 2024, with US banks holding roughly $300 billion in loans outstanding to private-credit providers as of June 2025.
The second is the headline-versus-shadow default rate. KBRA's Q3 2025 Middle Market Borrower Surveillance Compendium identified a shadow default rate of approximately six percent when payment-in-kind amendments added post-origination — bad PIK — are reclassified as de facto defaults.57 The headline private-credit default rate at the same date stood at approximately 2.1%. PIK-by-amendment rose from 2.6% of private-credit volume in 2021 to 6.1% by Q3 2025; by Q1 2026 the bad-PIK share reached 6.4% of total private-debt volume per Lincoln International valuation data. The gap between the headline and the shadow rate is what the Method's audit-posture principle surfaces against consensus.
The third is the annuity-channel arithmetic. Apollo's Athene subsidiary reported gross premiums and deposits of $83.65 billion in 2025, with annuities accounting for $46.16 billion and funding agreements $35.38 billion; net reserve liabilities totalled $271.23 billion, seventy-two percent in annuity products. Athene's ACRA 1 and ACRA 2 capital-support vehicles held $142.1 billion of retroceded reserve liabilities at year-end 2025.58 Athene is Iowa-domiciled with substantial Bermuda reinsurance. CoreWeave's $8.5 billion DDTL 4.0 facility closed in March 2026 as the first investment-grade-rated GPU-backed financing, with Blackstone Credit & Insurance as the lead investor block.59
Applied here · The Falsifiability Method · §2a Audit postureThe Falsifiability Method — audit posture
“The Math Doesn't Work carries thirty-three footnotes across roughly seven and a half thousand words. The footnote density is not because the topic is academic. It is because the audit trail is the discipline visible. Any reader can audit any claim by clicking through to the named source. Anything the reader cannot verify against a primary source is not in the document.”
Read →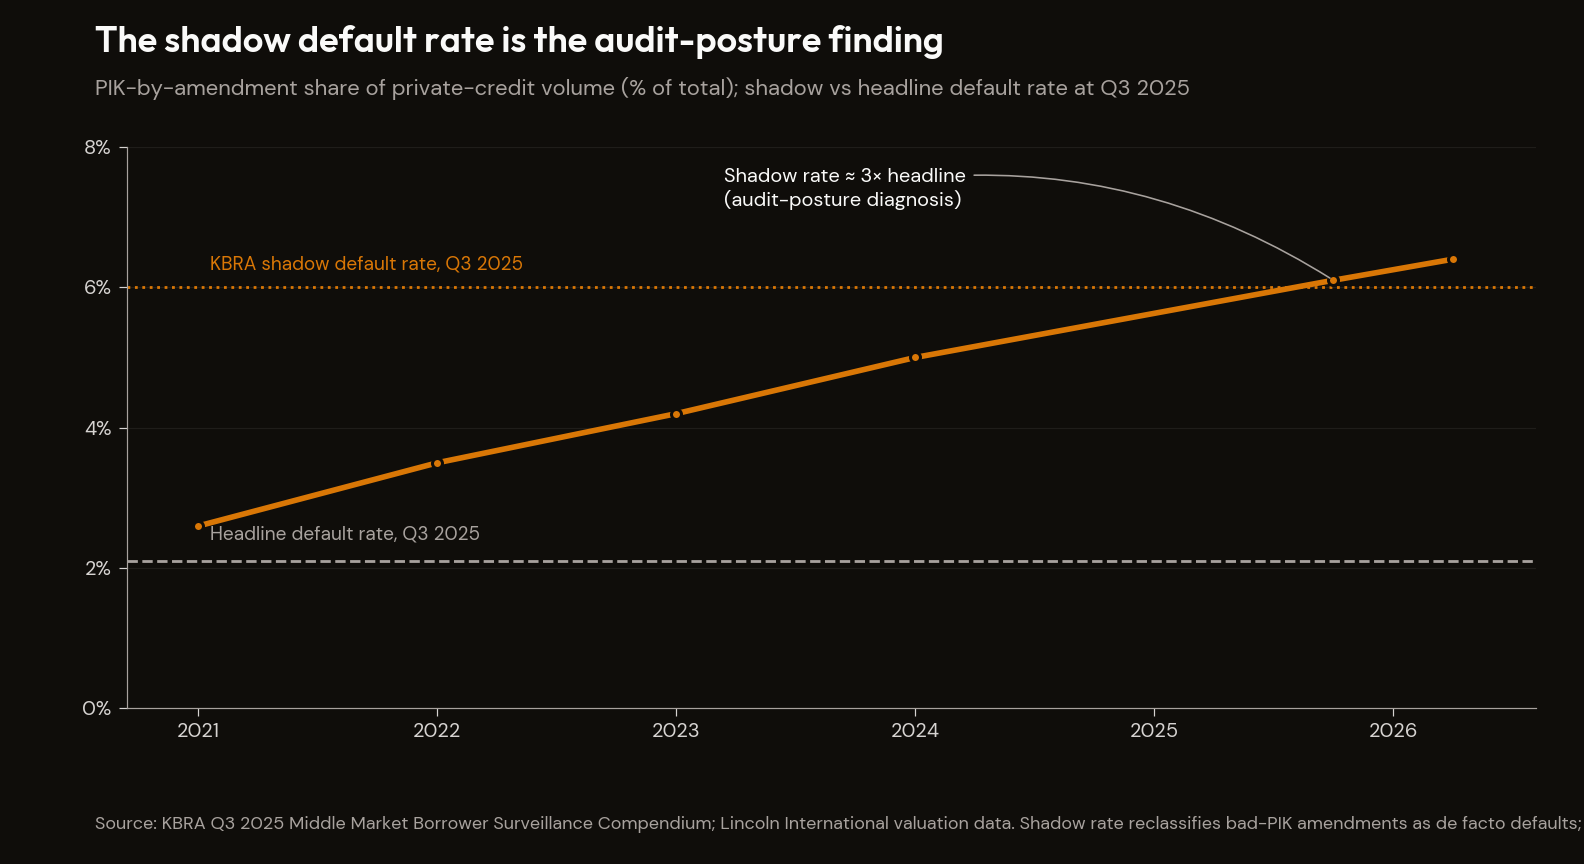
First-order chokepoints
Six platforms define the first-order layer.
Apollo / Athene is the largest integrated private-credit-and-insurance platform. Apollo originates the credit; Athene buys and holds it. Athene's $440+ billion of total assets sit alongside $271 billion of net reserve liabilities, with ACRA reinsurance vehicles providing third-party capital while keeping spread economics inside Apollo's fee base.58 The pension-to-annuity conversion trade — converting tens of billions of dollars of corporate pension obligations from Alcoa, AT&T, Lockheed Martin, and others into annuities, a meaningful share backstopped offshore in Bermuda — is the manuscript's named instance of the integrated structure.
Blackstone Credit & Insurance (BXCI), the former GSO platform, manages over $220 billion for approximately twenty-four insurance clients, with total BXCI AUM around $350 billion.60 BXCI does not own insurance companies but manages insurer assets and originates the credit those insurers hold. The CoreWeave $8.5 billion DDTL 4.0 facility — first investment-grade-rated GPU-backed financing — anchored by BXCI and meaningfully oversubscribed, set the structural template for GPU infrastructure as a new insurer-eligible asset class. The manuscript's structural template is CoreWeave frame is the BXCI anchor in action.
KKR / Global Atlantic integrates KKR's $744 billion AUM with the Global Atlantic insurance platform's $219 billion balance sheet.61 KKR's Credit and Liquid Strategies platform totals $322 billion; Asset-Based Finance AUM reached $75 billion in 2025 (up twenty percent year-on-year) through structured origination partnerships, including the Harley-Davidson loan portfolio. The structural pattern is the same as Apollo-Athene: a captive insurance balance sheet provides the long-duration funding for the credit origination platform.
Ares Management is the largest credit-only manager — Credit Group AUM $406.9 billion of $622.5 billion total AUM at end-2025, with $145.8 billion deployed globally in 2025.62 Scale in senior lending (ninety-six percent senior loans globally) lets Ares set pricing benchmarks across mid-market direct lending. Ares holds no captive insurance but is the largest standalone credit platform; the lender-of-choice relationship with PE sponsors needing execution certainty is the pricing-power mechanism.
Brookfield Reinsurance / American Equity Life combined when Brookfield acquired AEL for $4.3 billion in 2024, with a roughly $10 billion in-force reinsurance block layered on top.63 Total insurance assets at Brookfield Reinsurance exceed $100 billion. Annuity-flow reinsurance via the IncomeShield product creates an ongoing pipeline of fixed-indexed annuity liabilities to backstop with Brookfield-managed private credit. AEL's senior bond rating upgrade (BBB- to BBB) reduces cost of capital and reinforces the spread-capture economics.
Blue Owl Capital holds $307.4 billion of AUM at end-2025, with the credit platform at $159.2 billion (Q1 2026) and approximately eighty-five percent of management fees flowing on permanent capital.64 Five regulated BDCs and the interval-fund infrastructure remove the redemption pressure that constrains leverage on competitor platforms.
On the income statement, the pricing power sits in the spread between the floating-rate origination yield on the credit and the fixed-rate annuity liability cost on the captive insurance book (Apollo-Athene, KKR-Global Atlantic, Brookfield-AEL); in the management-fee line on permanent capital (Blue Owl at ~85%); and in the rating-agency NRSRO designation revenue (Moody's and S&P at ~80% of structured credit ratings). The Bermuda Class E regulatory regime is what makes the first spread economically viable; the NRSRO designation is what makes the rated debt eligible for insurance-capital deployment.
| Platform | Position | Key metric | Mechanism |
|---|---|---|---|
| Apollo / Athene | Largest integrated PC-insurance platform | $440B+ Athene assets; $271B net reserve liabilities; ACRA $142.1B retroceded | Apollo originates; Athene holds; Bermuda reinsurance |
| Blackstone Credit & Insurance (BXCI) | Largest insurer-asset manager | $220B+ for ~24 insurance clients; ~$350B BXCI AUM | CoreWeave DDTL 4.0 template; manages without owning |
| KKR / Global Atlantic | Integrated credit + insurance | $744B KKR AUM + $219B Global Atlantic balance sheet | Captive insurance funding for credit origination |
| Ares Management | Largest credit-only manager | $406.9B Credit Group AUM (of $622.5B total); $145.8B 2025 deployment | Lender-of-choice scale (96% senior loans globally) |
| Brookfield Re / AEL | Annuity-flow reinsurance | $100B+ Brookfield Re insurance assets | IncomeShield FIA pipeline; AEL credit upgrade BBB- → BBB |
| Blue Owl Capital | Permanent-capital credit | $307.4B AUM ($159.2B credit Q1 2026); ~85% mgmt fees on permanent capital | Five BDCs + interval-fund infrastructure removes redemption pressure |
The Math Doesn't Work — AI–private credit fusion
“Over a hundred billion dollars of new hyperscaler debt was issued in 2025 alone, with Wall Street strategists projecting well over a trillion more to finance the buildout. The structural template is CoreWeave. Its multi-billion-dollar GPU-collateralised loan facility, which closed in March 2026 as the first investment-grade-rated debt of its kind, had Blackstone Credit & Insurance as the lead investor block.”
Read →Second-order chokepoints
Below the named platforms sits the layer that determines whether the platforms' asset valuations, capital treatment, and regulatory access actually hold.
Moody's and S&P Global Ratings are the NRSRO duopoly that rates the private-credit instruments insurers hold.65 Fitch is the smaller third. The CoreWeave DDTL 4.0 facility was rated A3 by Moody's and A (low) by DBRS Morningstar — first investment-grade rated GPU-backed financing. The mechanism is regulatory-coupled: insurance capital rules (NAIC RBC, BMA BSCR) are calibrated to NRSRO ratings; a rating upgrade unlocks a different, lower-cost capital pool. Moody's and S&P collectively hold approximately eighty percent of structured credit rating revenue. Rating methodology for private-credit assets (illiquid, model-dependent) is not standardised across the agencies — a structural opacity inside the duopoly.
The Bermuda Monetary Authority is the prudential regulator for the Bermuda asset-intensive reinsurance cluster that backstops US annuity obligations. The Bermuda reinsurance market totals approximately $1.52 trillion of assets.66 BMA's Bermuda Solvency Capital Requirement sets capital standards for Class E insurers ($500 million+ assets). New rules effective January 2026 require granular public disclosure of assets and product-level reserves; prior approval is required for new block transactions. Athene's ACRA vehicles and Brookfield Reinsurance operate under this regime. The BMA is, in practical effect, the regulatory architecture that makes the spread-capture trade economically viable; tightening of Class E rules compresses the trade simultaneously across the named first-order platforms.
Milliman, Oliver Wyman, Willis Towers Watson, and Aon are the actuarial firms that sign asset-adequacy testing opinions on reserves for asset-intensive life reinsurance. The first AG ReAAT reports under the new NAIC framework are due in 2026.67 AG 55 reports specifically address hard-to-model alternative assets — private credit being the named instance. Actuarial sign-off is the final gating mechanism between private-credit asset valuations and reported reserve adequacy; if the appointed actuary won't sign, the insurer's reported balance sheet doesn't clear.
The GP-led continuation vehicle infrastructure — Ardian, HarbourVest, Lexington, Goldman PSI, Blackstone Strategic Partners — runs the secondary market through which private credit and PE positions get marked when GPs need to roll assets. 2025 CV market closed $107 billion in volume (record); total secondary market $232 billion.68 Buyer concentration means a handful of secondaries desks set clearing prices for the marks. The same concentration determines whether illiquid positions can be monetised at par — a key assumption embedded in BDC and interval-fund NAV calculations.
NAIC and state insurance regulators — particularly the Iowa Insurance Division, Athene's domestic regulator — govern the state-level RBC framework through which insurance-linked capital is deployed into private credit.69 Insurance-linked capital deployed into private credit reached approximately $180 billion in 2025, up from $120 billion in 2023. NAIC model law changes (AG 55, annuity best-interest safe harbour) propagate through every state's compliance architecture.
What would change my read
Three named thresholds with named mechanisms.
The first is a second redemption squeeze in semi-liquid private credit. The Q1 2026 redemption pattern — Blackstone's flagship private-credit fund facing the largest quarterly tender in its history, Blue Owl's two main vehicles seeing redemption demand of twenty to forty percent against five percent gates, and over $250 billion of listed alternative-asset manager market cap erased in a single month — was the first real liquidity test of the semi-liquid structure. A repeat at scale (a second quarter of gate-triggered redemptions at a major sponsor with NAV above $10 billion) would force mark-to-market selling into an illiquid secondary market, with GP-led continuation vehicle clearing prices falling below carried-cost values. The institutional cascade would go price-relevant.
The second is BMA or NAIC regulatory tightening on asset-adequacy testing or Bermuda Class E reserves. A 1:1 admissible-asset requirement at the BMA for private-credit positions in Bermuda reinsurance vehicles would compress the spread-capture economics that make the Apollo/Athene / Brookfield template work. NAIC's AG 55 enforcement would surface the asset-adequacy gap that PIK-by-amendment currently obscures. Either path would re-rate the spread-capture mechanism that drives new annuity supply.
The third is a CoreWeave-class default in the GPU-collateralised loan complex, or a private-credit reclassification on insurance balance sheets driven by Moody's or S&P revising rating methodology to treat PIK income and illiquid collateral values more conservatively. A CoreWeave default would re-rate the GPU-debt asset class downward across every insurance-linked exposure. A rating methodology revision would push existing private-credit CLOs and BDC notes below the investment-grade thresholds insurance investment guidelines require; forced selling would compound the liquidity mismatch the first threshold already names.
If a second redemption squeeze fires, if the BMA tightens, or if the rating-agency methodology revises, the read on the bottleneck shifts toward expropriation rather than persistence. If none fires, the integrated bubble persists into the next observation. The thresholds are named.
What survives, what is structurally protected
Six cross-cutting observations.
The integrated bottleneck loop. The first three sectors — energy, materials, chips — are the same physical bottleneck stack viewed from three layers: raw inputs feed infrastructure which delivers the manufactured high-value output. The chip stack cannot scale without the grid which cannot scale without the materials which cannot scale without sovereign export licensing on the upstream chemistry. A constraint at any one layer transmits to the others. The DeepSeek-class efficiency curve, if it matures, eases the chip-stack constraint and the grid constraint simultaneously by reducing the kWh required per FLOP; an electrical-steel scaling miss at Cleveland-Cliffs tightens the transformer supply curve, which tightens the data-centre interconnection curve, which tightens the chip-stack utilisation curve. The three sectors are operationally one structure with three different financial reporting lines.
Demographic compounding is the slowest bottleneck and the most policy-durable. Sector 4 operates on a 25-year demand curve that the Trustees Report and the CBO have both been publishing for decades. The people who turn 65 between now and 2040 are already alive; the curve cannot be deferred by macro narrative or by trigger event. The pricing power that holds across a demographic curve is structurally harder to expropriate than pricing power that holds across a cyclical demand burst — and the holders of demographic pricing power know it, which is why GLP-1 patent extension, Medicare Advantage vertical integration, and senior-housing REIT consolidation all moved aggressively against the curve in 2024 and 2025. Demographic pricing power is the most patient pricing power. The reader is invited to draw the corollary about which sectors carry the most calendar-durable spread capture.
Financial transmission absorbs all of the above. Sector 5 is where stress from the first four sectors lands. Hyperscaler capex flows into private credit through the CoreWeave-template trade; private credit flows into insurance balance sheets through Apollo-Athene and the BMA Class E architecture; insurance balance sheets flow into annuity end-buyers whose contracts cannot be unwound. The end-buyer is a 75-year-old retiree whose annuity is the structure that supports their monthly cheque. The pricing power in the transmission layer is captured precisely because the end-buyer cannot exit the trade. Any sector's stress eventually lands here, mediated by the rating agencies and the actuarial sign-off.
Sovereign-protected pricing power is harder to expropriate than IP-protected pricing power. The IP cliff has a date — Ozempic's patent in 2030, Mounjaro's in 2036, every drug class in the FDA Orange Book carries its own visible terminus. Sovereign protection does not. China's rare-earth processing dominance, the Bermuda Class E reinsurance regime, the NAIC state-RBC framework, the Indonesian in-country smelting requirement, the Dutch ASML export-control compliance — each is a regulatory or geopolitical structure that took decades to build and would take decades to deconstruct. The reader who wants to identify the most durable pricing-power concentrations starts with the sovereign layer, not the IP layer. The materials sector, the Bermuda backstop, and the chip-stack export-control regime are the most sovereign-locked. The branded-drug duopolies are the most IP-cliff-exposed.
The expropriability gradient. Within the second-order layer of every sector, the rating-agency duopoly is the most expropriable chokepoint — it is regulatory-constructed and could be regulatory-deconstructed. Moody's and S&P depend on the NRSRO designation; revoke the designation or introduce competitive alternatives and the duopoly compresses. The peptide CMOs are the second-most-expropriable — capacity build-out is a finite-capex problem, not a structural one, and Bachem's Building K plus Polypeptide's Malmö expansion already mark the path. The least expropriable are sovereign-gated supply chemistries: NdPr separation, ABF resin, EUV photoresist, HALEU enrichment, Class E reinsurance. Each carries decades of accumulated industrial chemistry or regulatory architecture; each would require a multi-decade replacement programme to substitute. The thresholds vary in difficulty by orders of magnitude.
| Tier | Chokepoint | Mechanism | Time-to-substitute |
|---|---|---|---|
| Most expropriable | Moody's + S&P NRSRO duopoly | Regulatory-constructed designation | Years (regulatory action) |
| Peptide CMO capacity (Bachem, Polypeptide) | Finite-capex problem; expansion path named | 2–4 years (under build) | |
| Mid | NAIC / state insurance-RBC framework | State-level capital rules | 5–10 years (rule-cycle) |
| DSCSA wholesale distribution oligopoly | Federal licensing regime | 10+ years (federal action) | |
| Least expropriable | NdPr separation chemistry (China 91%) | Industrially-scaled solvent extraction | Decades |
| ABF resin (Ajinomoto 95%) | Single-firm dielectric chemistry | Decades | |
| EUV photoresist (Japan 95%) | Three-firm chemistry oligopoly | Decades | |
| HALEU enrichment | Pre-commercial; pilot-scale at Centrus | Decade+ (DOE buildout) | |
| Bermuda Class E reinsurance | Sovereign regulatory architecture | Decades |
The Method's discipline applied across the map. Each sector named primary-source attribution for the arithmetic. Each sector named the first-order holders and the second-order chokepoints. Each sector named what would change my read with numeric threshold, mechanism, and primary source. The audit trail is the map. The map is descriptive, not predictive. Describe the regime, name the triggers, refuse to call the dates — the Method's §4b principle applied at scale across five sectors. The reader holds the snapshot; the falsifiability thresholds tell the reader when the snapshot needs re-drawing; the date the resolution arrives is the calendar's question, not the document's.
The Bottleneck Map is the first follow-up product applying the Falsifiability Method against new material. The Capability Stack will apply the same Method to human capital — what capabilities compound and what depreciates in the K-shape regime — and will reference back to the sectors named here when the human-capital story intersects with a specific chokepoint (peptide-chemistry researchers and Sector 4; semiconductor process engineers and Sector 3; commodity-supply-chain operators and Sector 2). The Scenario Playbooks will apply the Method to conditional posture frameworks — branching survival-and-opportunity reads against which way the watch window resolves — and will reference the falsifiability clauses named here as the conditioning events.
The thresholds in each sector's falsifiability clause name when the map needs re-drawing. Until then, the snapshot stands.
Footnotes
-
IEA — Energy and AI report (April 2025); IEA Electricity 2026 executive summary. ↩
-
PJM Inside Lines — 2025/2026 auction results, July 2025; IEEFA — Projected data center growth and PJM capacity prices. ↩
-
Troutman / Tamarindo — Off-Grid Data Centers, February 2026. ↩
-
Wood Mackenzie Q2 2025 transformer lead-time survey, via Industrial Sage; PV Magazine USA, May 2026. ↩ ↩2
-
Utility Dive — GE Vernova gas turbine backlog hits 100 GW, Q1 2026. ↩
-
Siemens Energy FY2025 press release; S&P Global — US gas-fired turbine wait times, May 2025. ↩
-
Constellation / Meta press release, 2025; Constellation Calpine acquisition close, March 2026. ↩
-
Vistra 10-K, filed February 2026; Vistra FY2025 results, February 2026. ↩
-
Prysmian FY2025 press release, February 2026; Nexans Q1 2026 financial information; NKT 2026 coverage, ts2. ↩
-
Electrical Trends — Eaton 2025 review, February 2026; ABB SF6-free portfolio. ↩
-
World Nuclear Association — uranium enrichment capacity (2022 data); Centrus DOE contract extension press release. ↩
-
Industrial Sage / Wood Mackenzie Q2 2025 transformer survey citing Cleveland-Cliffs as sole US GOES producer. Sole-source status not yet verified in primary AISI or DOE documentation; flagged as estimate. ↩
-
BWX Technologies — Project Pele microreactor full core delivery; Power Magazine — TRISO-X NRC license. ↩
-
PJM 2027/2028 Base Residual Auction Report, December 2025. ↩
-
IEA — Critical Minerals Outlook 2024; IEA commentary on critical-minerals export controls, 2025. ↩ ↩2
-
USITC executive briefing on germanium and gallium export controls. ↩
-
CSIS — China's new rare-earth and magnet restrictions, October 2025. ↩ ↩2
-
International Copper Study Group survey data on declining ore grade (1.5% in 1900 to 0.6% in 2020), corroborated via multiple secondary analyses; ICSG selected copper statistics. Primary dataset not directly fetched in this research pass; flagged as corroborated estimate. ↩
-
Lynas FY2024 Annual Report, ASX announcement October 2024. ↩
-
SQM investor relations and Benchmark Minerals coverage on Atacama lithium production. ↩
-
Kazatomprom Integrated Annual Report 2024; corroborated via World Nuclear News. ↩
-
Neo Performance Materials — Estonia facility overview; Neo HRE separation commissioning announcement. ↩
-
Albemarle Kings Mountain factsheet; Albemarle Q3 2024 results. ↩
-
Tom's Hardware — Big Tech AI spending plans reach $725 billion; CNBC — AI spending across Google, Microsoft, Meta, Amazon (Feb 2026). ↩
-
Digitimes — TSMC CoWoS capacity and NVIDIA equipment booking, December 2025; FinancialContent — TSMC quadruples advanced packaging capacity. ↩
-
Counterpoint Research — global DRAM and HBM market share; CNBC — SK Hynix beats Samsung 2025 profit on AI memory; Astute Group — SK Hynix 62% of HBM, Micron overtakes Samsung. ↩
-
Alphastreet — Broadcom custom chip strategy and $60B hyperscaler AI infrastructure market; Ad-hoc-news — Broadcom 60% market share and custom silicon empire. ↩
-
TradingKey — ABF Ajinomoto NVIDIA AI supply chain analysis; Convergence Analysis — securing the substrate behind every chip. ↩
-
TrendForce — Japan ramps up photoresist investment for 2nm chips, November 2025; Fountyl — Japanese companies and EUV photoresist supply. ↩
-
imec — Mitsui Chemicals CNT pellicle partnership; Grand View Research — EUV pellicle market report. ↩
-
Yahoo Finance — KLA gaining share in AI chip metrology; Fortune Business Insights — semiconductor metrology and inspection equipment market. ↩
-
USITC executive briefing — Ukraine neon and semiconductors; CSIS — Russia / Ukraine impact on chip-production gas markets. ↩
-
Texas Hospital Association / Protected Income — record 4 million Americans turning 65 in 2024. ↩
-
SSA 2025 Trustees Report summary; CRS — Worker-to-beneficiary ratio analysis. ↩
-
CBO publication 62165 — Medicare HI trust fund projection, February 2026; AHA — CBO projects HI trust fund solvent until 2040. ↩
-
Combined Novo Nordisk and Eli Lilly GLP-1 disclosures — see 45 and 46. ↩
-
CMS statement on Leqembi Medicare coverage following FDA traditional approval; Eli Lilly — Kisunla (donanemab) FDA approval. ↩
-
DaVita Q4 2024 results, February 2025; LPE Project — dialysis duopoly market share analysis. ↩
-
Health Affairs — UnitedHealth physician pay differential study; Medicare Market Insights — UnitedHealth Group 2024 results. ↩
-
Welltower Q4 2024 results; Matthews — 2024 Senior Housing REIT Report. ↩
-
Bachem — Building K and peptide-production expansion; Pharmaceutical Manufacturer — Bachem and Polypeptide capacity expansion. ↩
-
Intuition Labs — McKesson, Cencora, Cardinal Health distribution analysis; Drug Channels Institute — 2024-25 Pharma Wholesalers Overview. ↩
-
USP Medicine Supply Map (April 2025) — API supply concentration; Brookings — US drug supply chain exposure to China. ↩
-
Manufacturing Dive — Novo Nordisk Catalent capacity expansion; Fierce Pharma — 2025 forecast on Novo / Lilly expansion. ↩
-
Federal Reserve FEDS Note — Bank Lending to Private Credit, May 2026; IMF Global Financial Stability Report, April 2026. ↩
-
KBRA — Private Credit Q3 2025 Middle Market Borrower Surveillance Compendium; ABF Journal — PIK divide and shadow distress. ↩
-
Athene Holding 10-K, FY2024; Athene 10-K summary, StockTitan. ↩ ↩2
-
CoreWeave press release — $8.5B DDTL 4.0 facility, first investment-grade GPU-backed financing, March 2026. ↩
-
Blackstone — Credit and Insurance (BXCI) business overview. ↩
-
KKR 10-K, FY2025, StockTitan summary; KKR Q4 2025 earnings release. ↩
-
Ares Management — Fourth Quarter and Full Year 2025 Results, February 2026; Ares 10-K, FY2025. ↩
-
Brookfield Reinsurance — AEL acquisition closed 2024; American Equity — Brookfield Reinsurance acquisition. ↩
-
Blue Owl 10-K, FY2025, StockTitan summary; Blue Owl Investor Presentation Q4 2025. ↩
-
Moody's — Private Credit ratings overview; CoreWeave DDTL 4.0 ratings via press release in 59. ↩
-
Skadden — BMA reflects on Bermuda reinsurance, April 2025; Insurance Business — US Treasury scrutiny of $1.52T Bermuda market; Conyers — 2025 Bermuda insurance bulletin. ↩
-
Milliman — enhancements to reserve adequacy requirements for life insurance; Mayer Brown — NAIC Summer 2025 highlights and asset-adequacy testing. ↩
-
CAIA — Continuation vehicle boom: structural shift or liquidity patch, February 2026; HarbourVest — secondaries and GP-led continuation vehicles. ↩
-
Athene Annuity and Life Company Q1 2025 statutory financial statement; Sidley — NAIC Summer 2025 national meeting update. ↩